$ agit // control plane
Scenario for the owner · Altered Graph.it

Where your money is in projects — and whether delivery is under control

You pay the team and contractors. What did you get — in money?

A control plane where each project's state is computed from facts: how much money is already recognised as revenue on acceptance, how much is still at risk, and which 2–3 decisions are waiting on you personally. Fewer status calls: you walk into the meeting already holding the picture and the decisions.

“Project state is computed from facts — and the interface proves it.”

Who this is for, and why

Owner · CEO · the executive who decides on the purchase

Accountable for the money and the outcome of a portfolio of projects. Pays the team and contractors; the money is often tied to milestone acceptance (acts, pilot and production operation). Doesn't want to manage tasks — wants to see where the money is, where the risk is, and what needs their decision.

The pain they pay to remove

“80% done” — but what about the money?
Percent of tasks closed doesn't tell you what the client accepted or what's already being paid. You need the picture in outcomes and acceptances, not activity alone.
Slips surface too late
That a milestone wasn't accepted and the payment is stuck surfaces when it's already too late: cash gap, client dispute, penalty.
No single money picture
Where the money is — revenue, backlog, at risk — across the portfolio is assembled by hand, by Monday, already stale.
Meetings instead of decisions
An hour of status goes to “who did what” instead of “what do I decide about this milestone”.

What they buy

Money, not tasks
Revenue / Backlog / At-risk — per project and across the portfolio. The amount under threat is visible at once.
One decisions screen
“Decide today” — milestones and blockers that need your action, with money and due date.
Early warning
An acceptance slip and a cash gap are visible before they become a problem, not after.
Trust in the numbers
Every status is computed from facts — closed tasks, signals, signed acceptances. Provable, not on trust.

Monday morning: your portfolio in 10 minutes

You open AG.it. Walked through the at-risk project “CRM rollout at Mercury Trade” — 60% done, the next payment of 1.5M ₽ for pilot-operation acceptance overdue.

Step screenshots show the detailed (expert) view. The live demo opens in the lightweight focus mode: the full toolset is one tap away — “expert” on the bottom dock or the F key.

1
Step 1 · Portfolio → Overview

The whole portfolio and the money on one screen
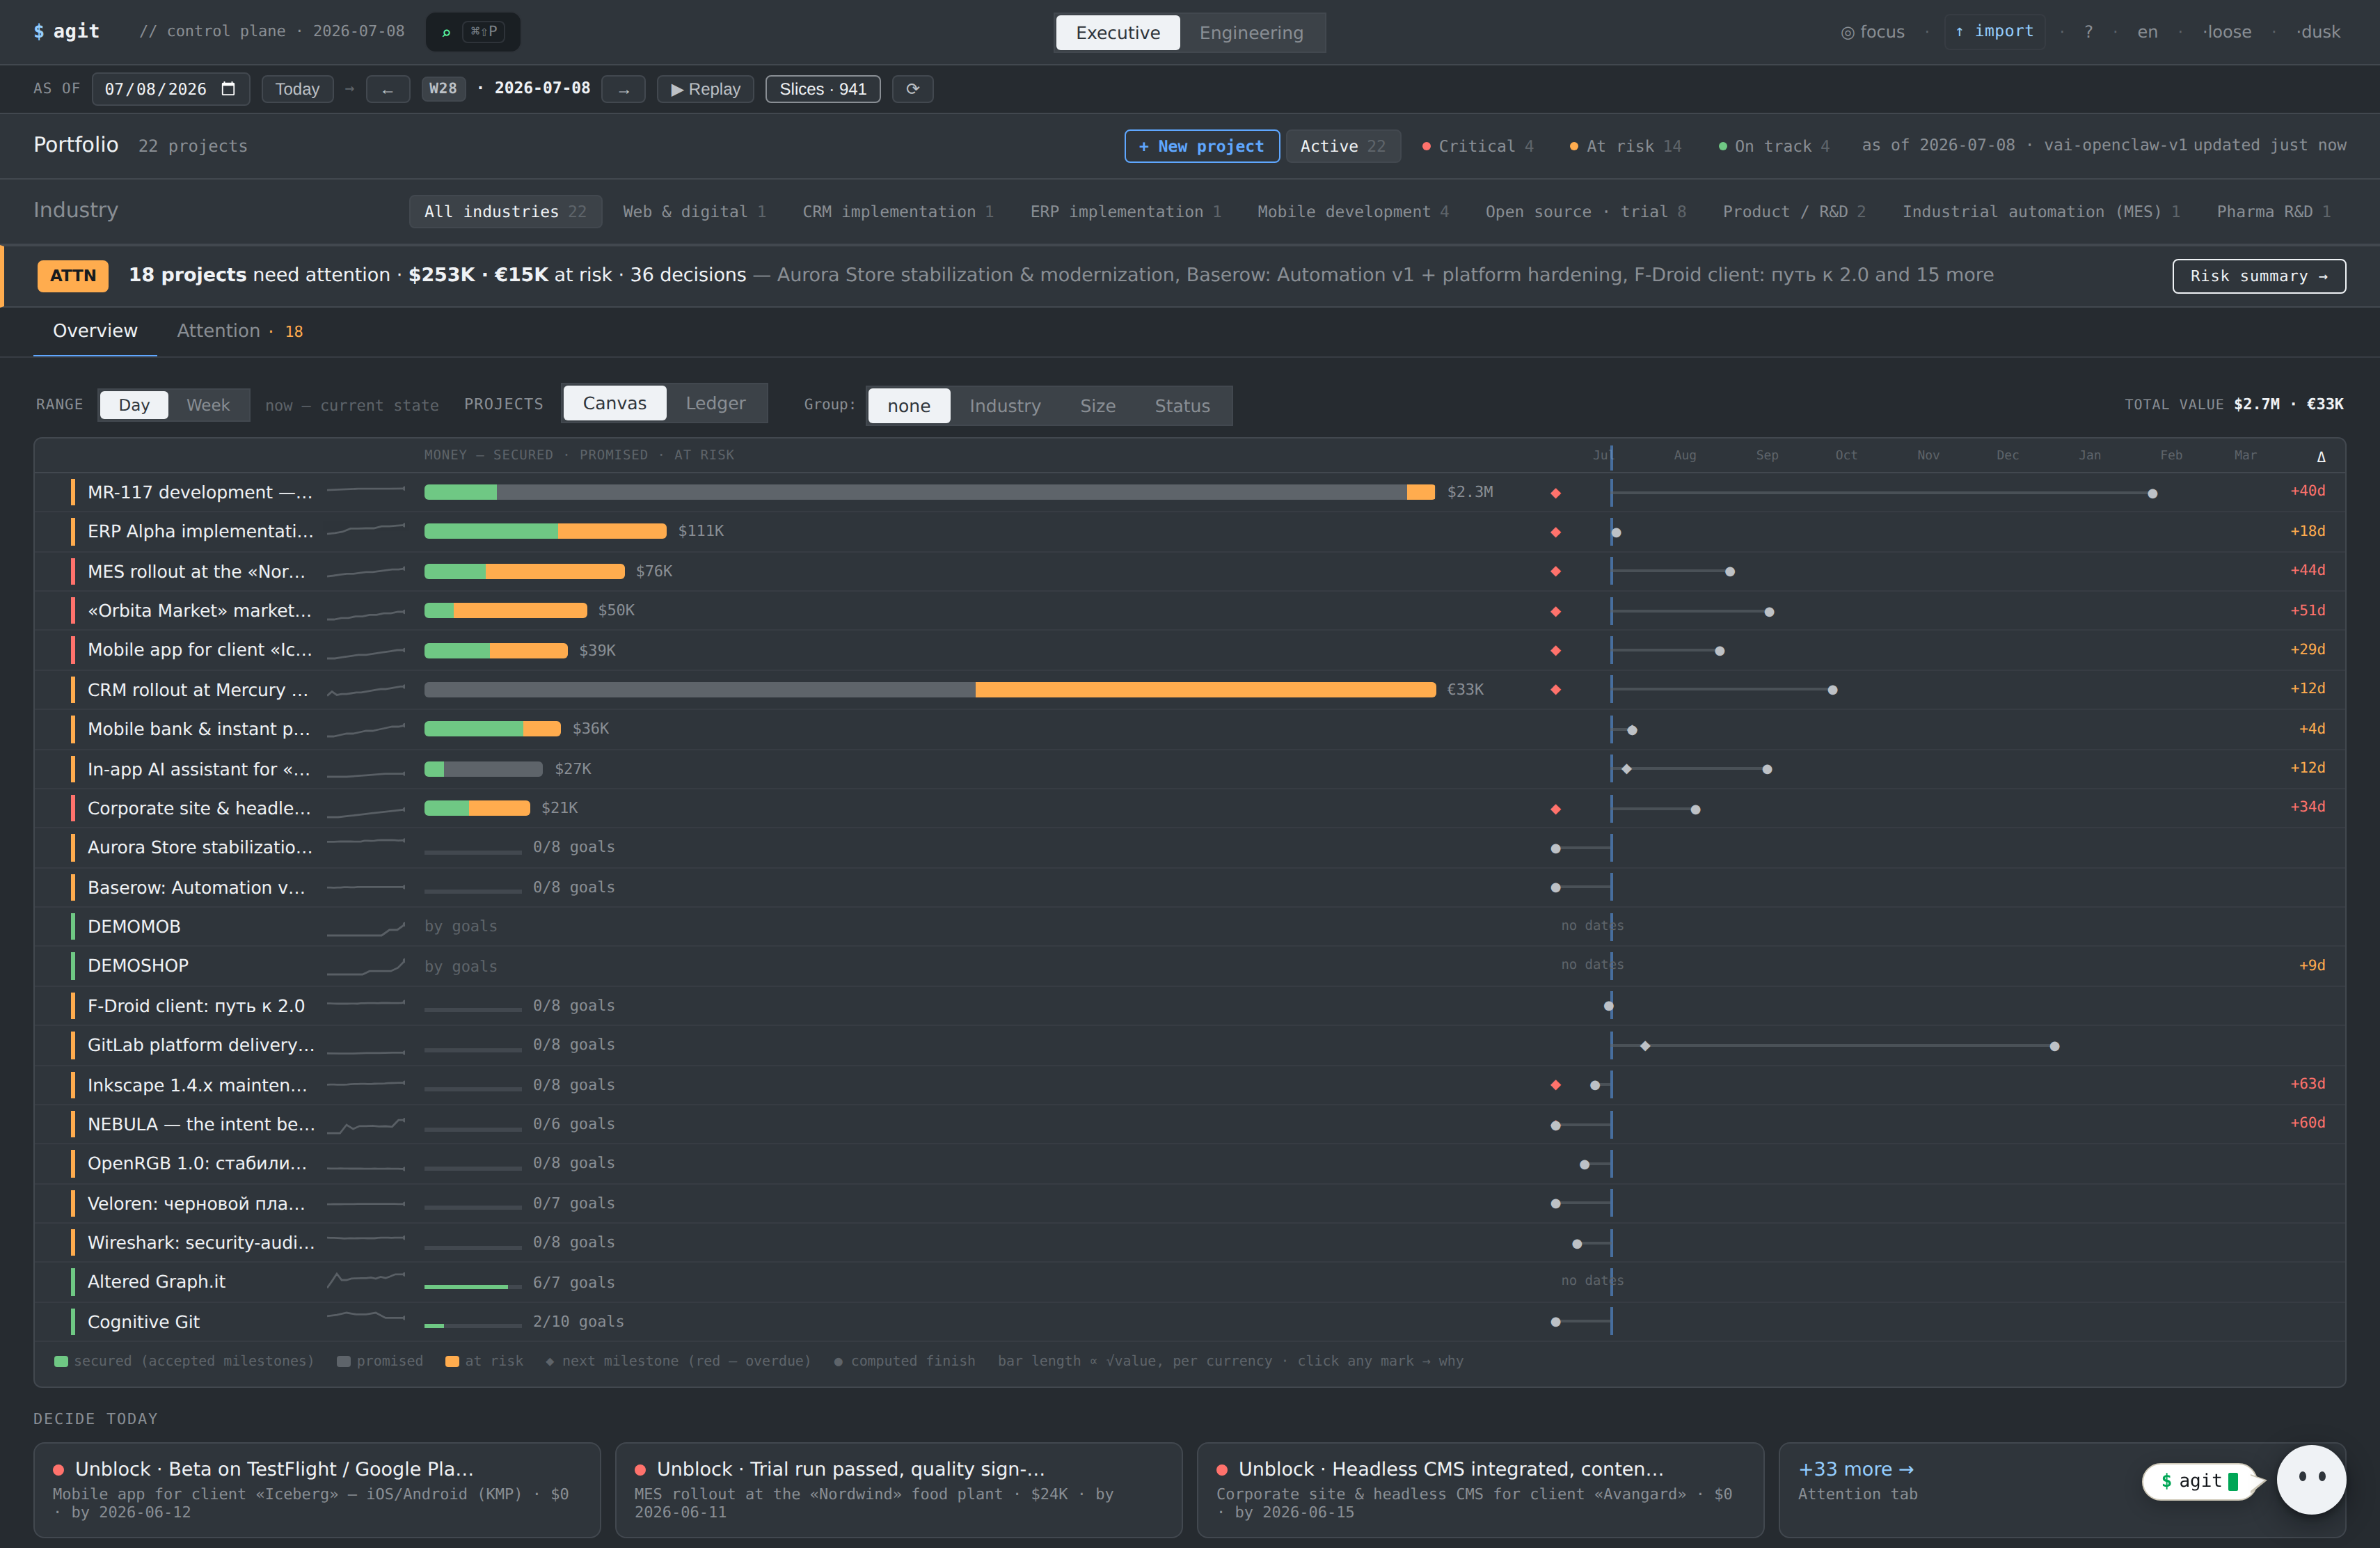
altered-graphit.com · Portfolio → Overview
The whole portfolio and the money on one screen
What you see

The portfolio canvas: 23 projects on one screen. Per project — a money bar (green secured · grey promised · orange at-risk), the next milestone ◆ and the computed finish ● on a shared time axis, the schedule slip. Groups by industry with live subtotals. Up top: “18 projects need attention · 24.3M ₽ at risk · 33 decisions”.

What you get

In 10 seconds you know where the money is and what's on fire — before the status meeting. At-risk projects are already flagged with the overdue figure.

2
Step 2 · Portfolio → Attention

Risks and decisions, quantified in money
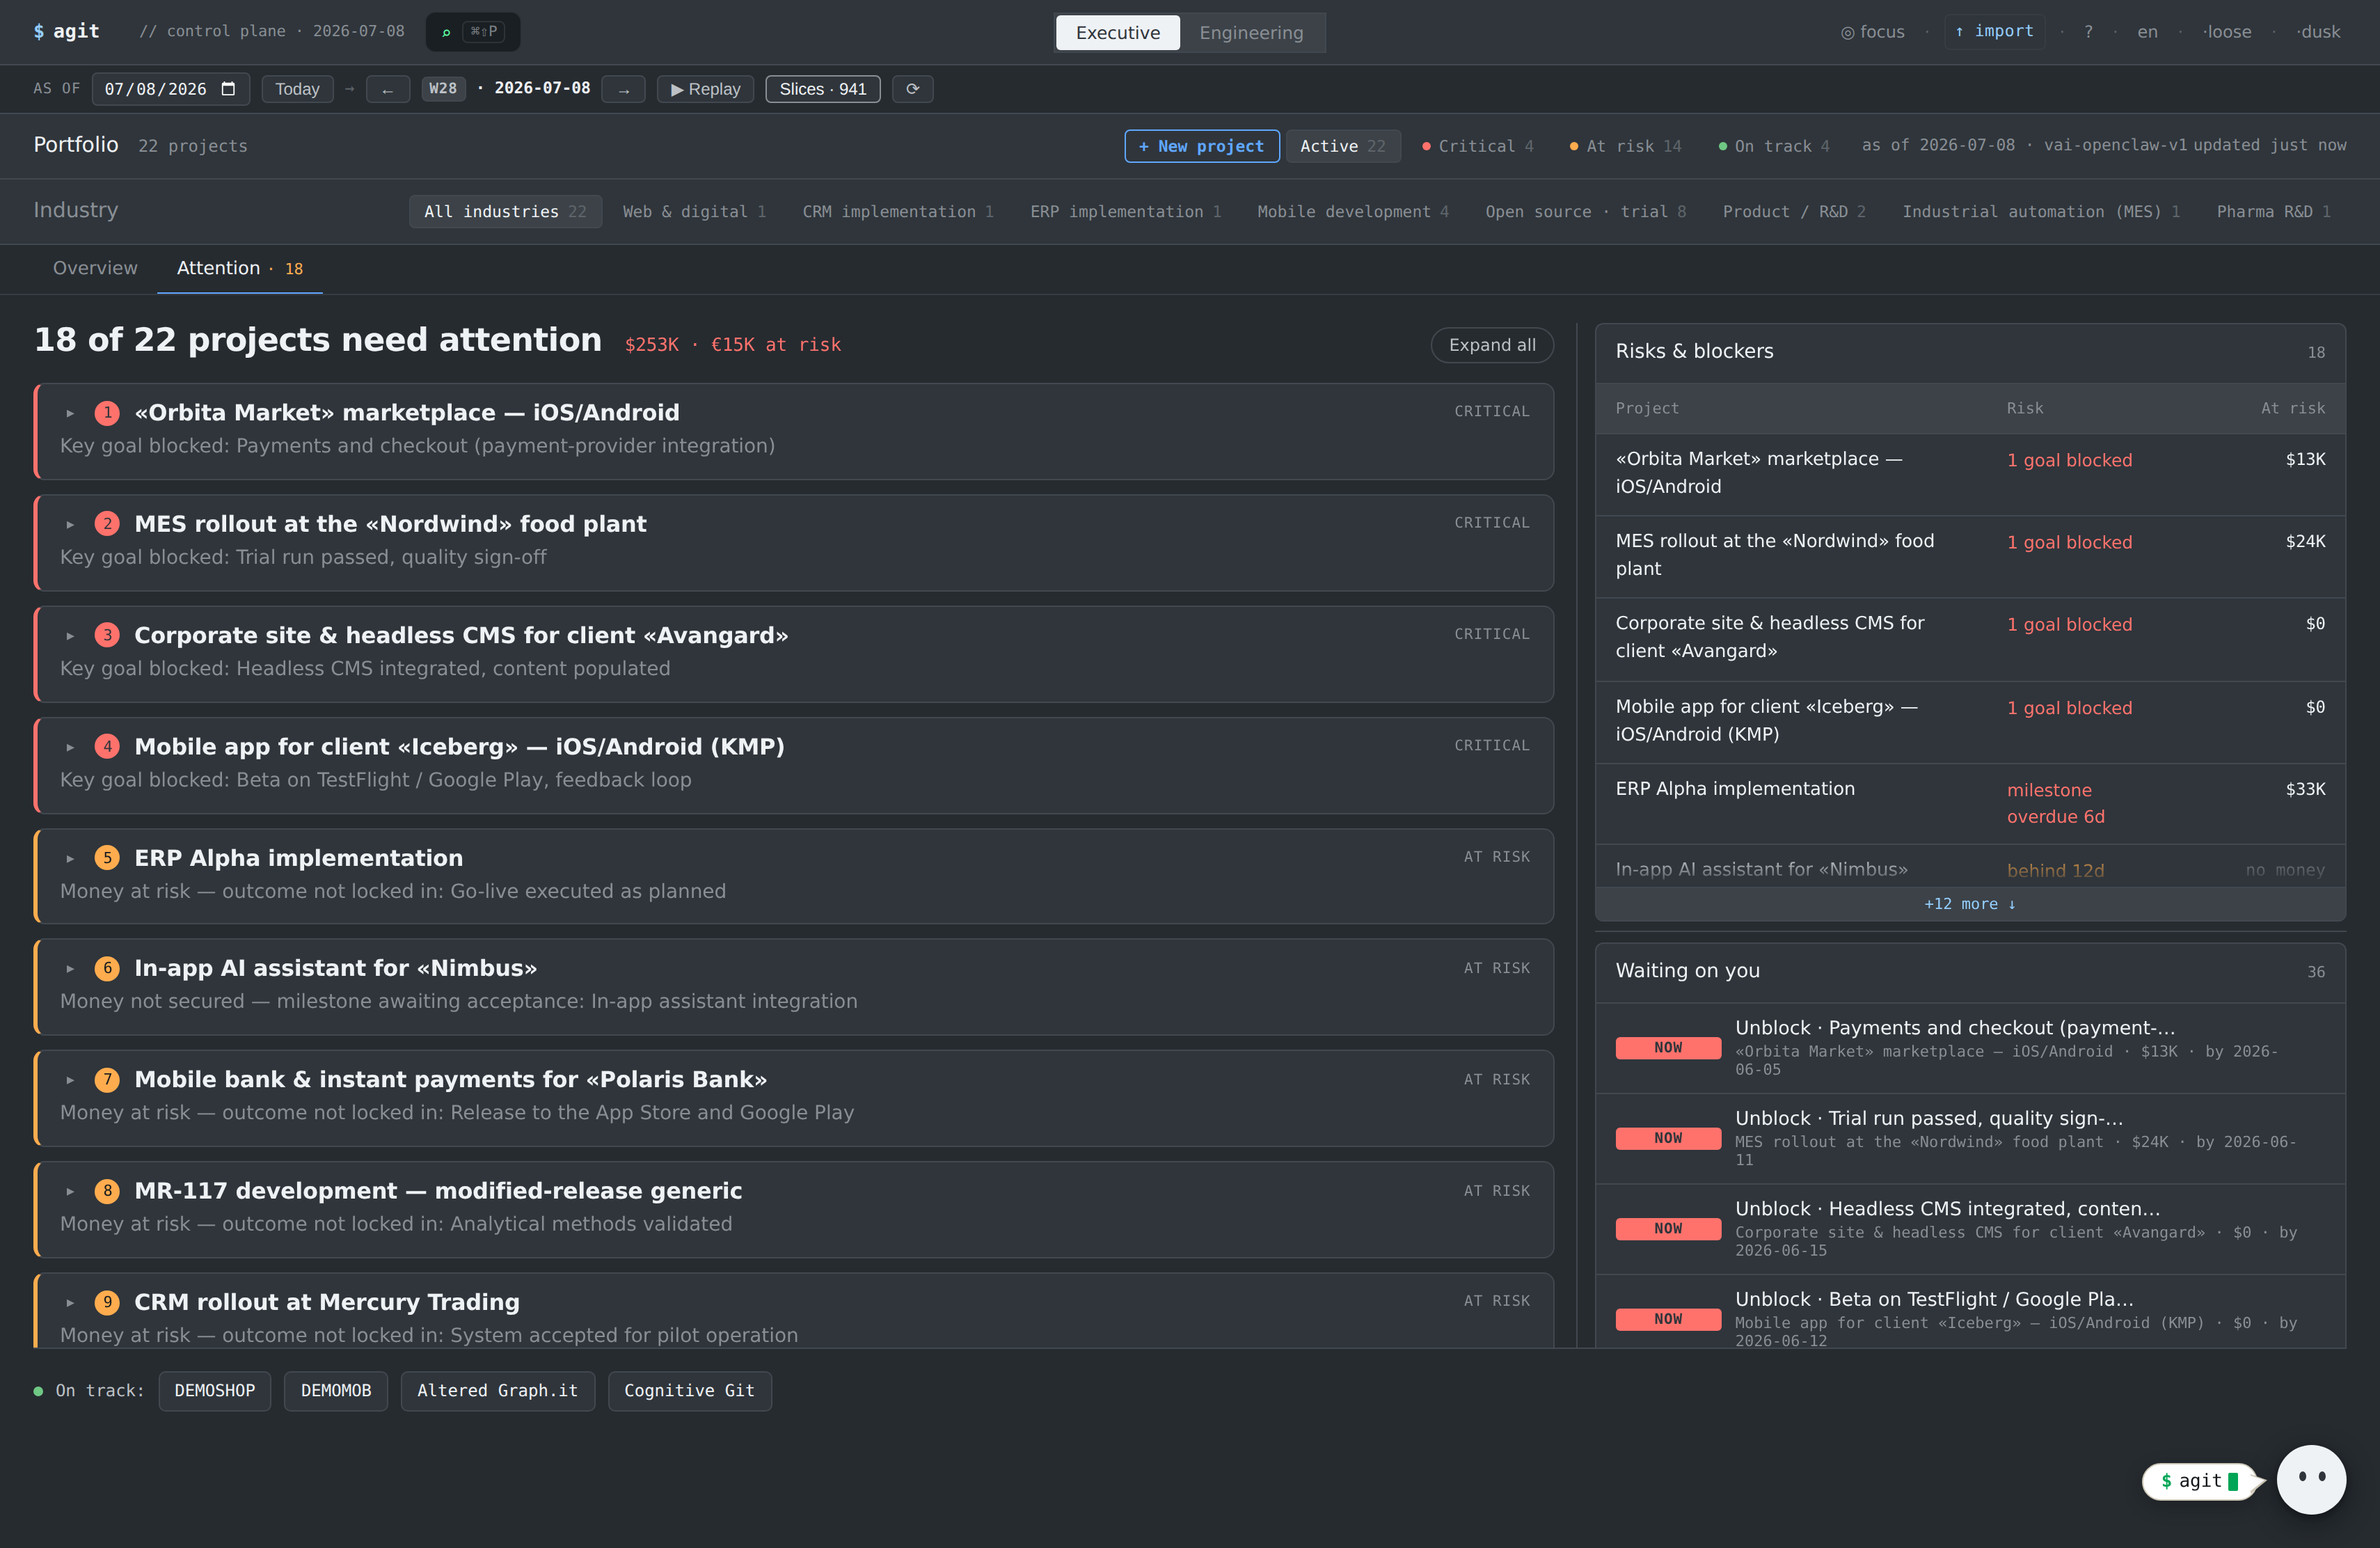
altered-graphit.com · Portfolio → Attention
Risks and decisions, quantified in money
What you see

“3 of 5 projects need attention · 4.5M ₽ · $4K at risk”. Problem cards on the left (expand on hover); a Risks & Blockers register and a “Waiting on you” list on the right.

What you get

A list of decisions instead of digging. Every risk is tied to money and a milestone — you see which action closes which payment.

3
Step 3 · Portfolio → Week

What moved this week — across every project
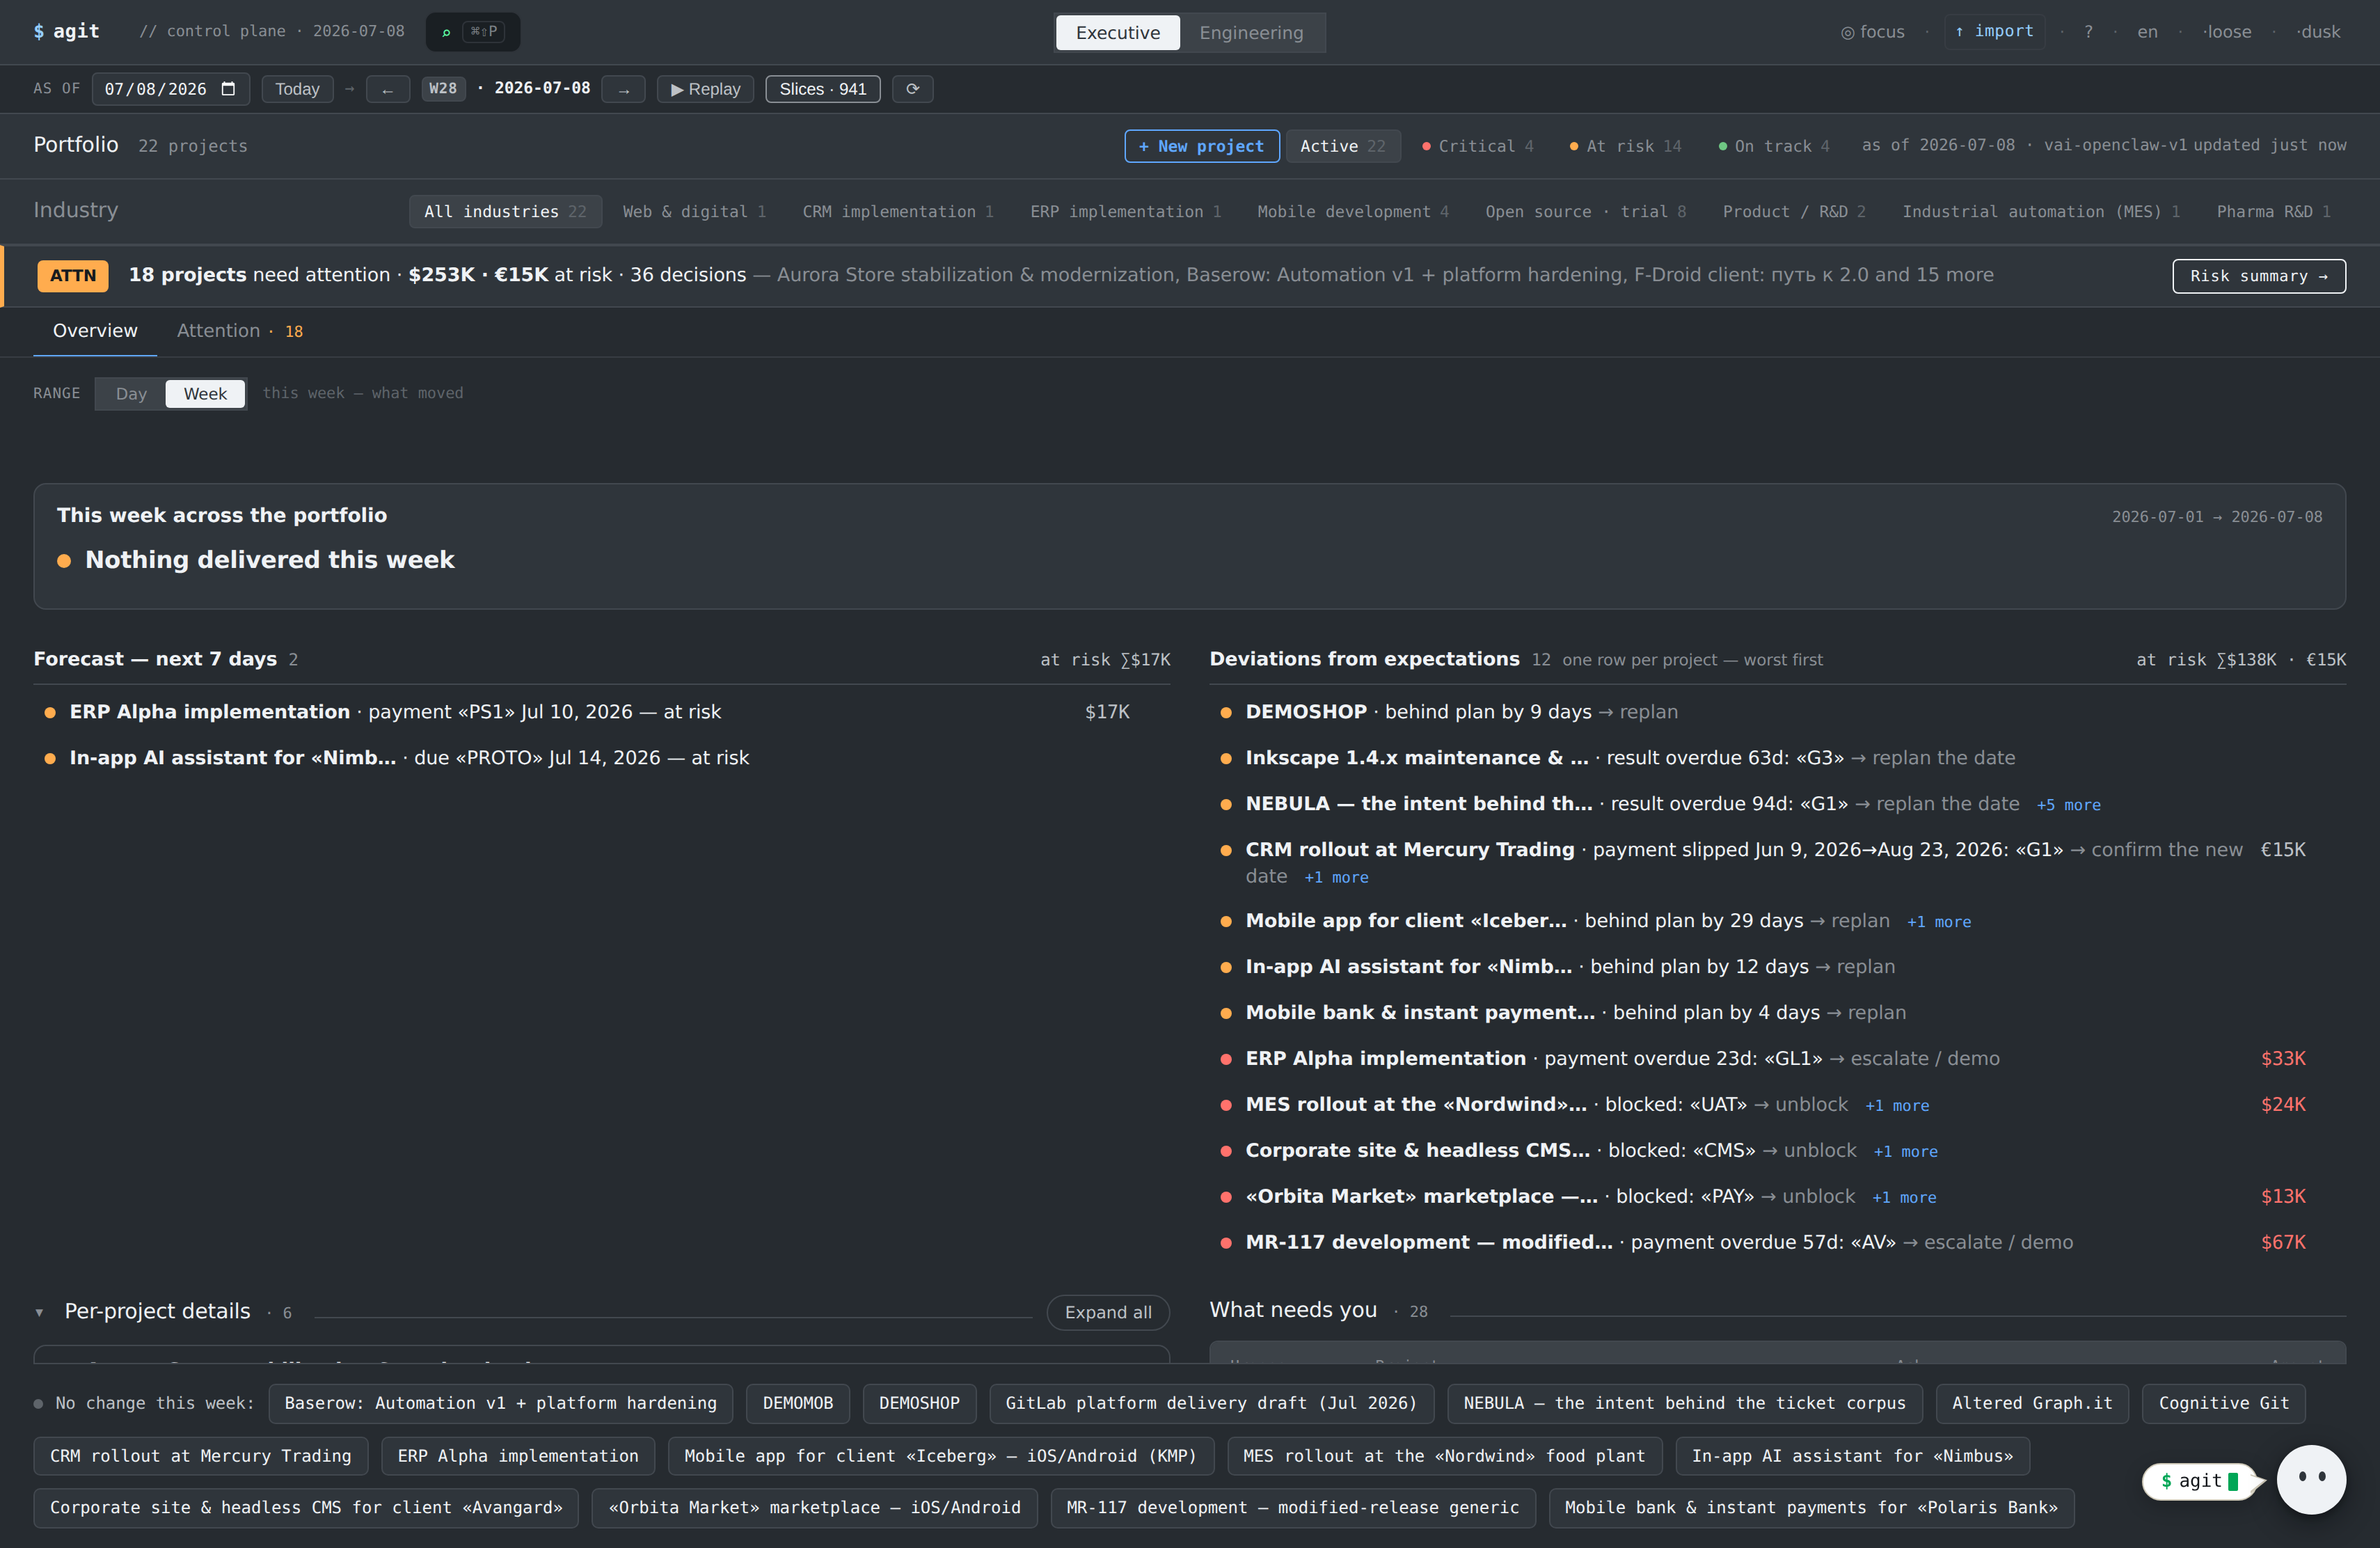
altered-graphit.com · Portfolio → Week
What moved this week — across every project
What you see

A ready weekly review: where there was movement, what closed with confirmation, where it's quiet (the “no change” strip is always pinned at the bottom). The pending-decisions list, assembled automatically.

What you get

A weekly report with no manual roll-up. You walk into the meeting with the picture, not questions for the team.

4
Step 4 · Project → Overview

Diagnosis at a glance: money at risk

altered-graphit.com · Project → Overview
Diagnosis at a glance: money at risk
What you see

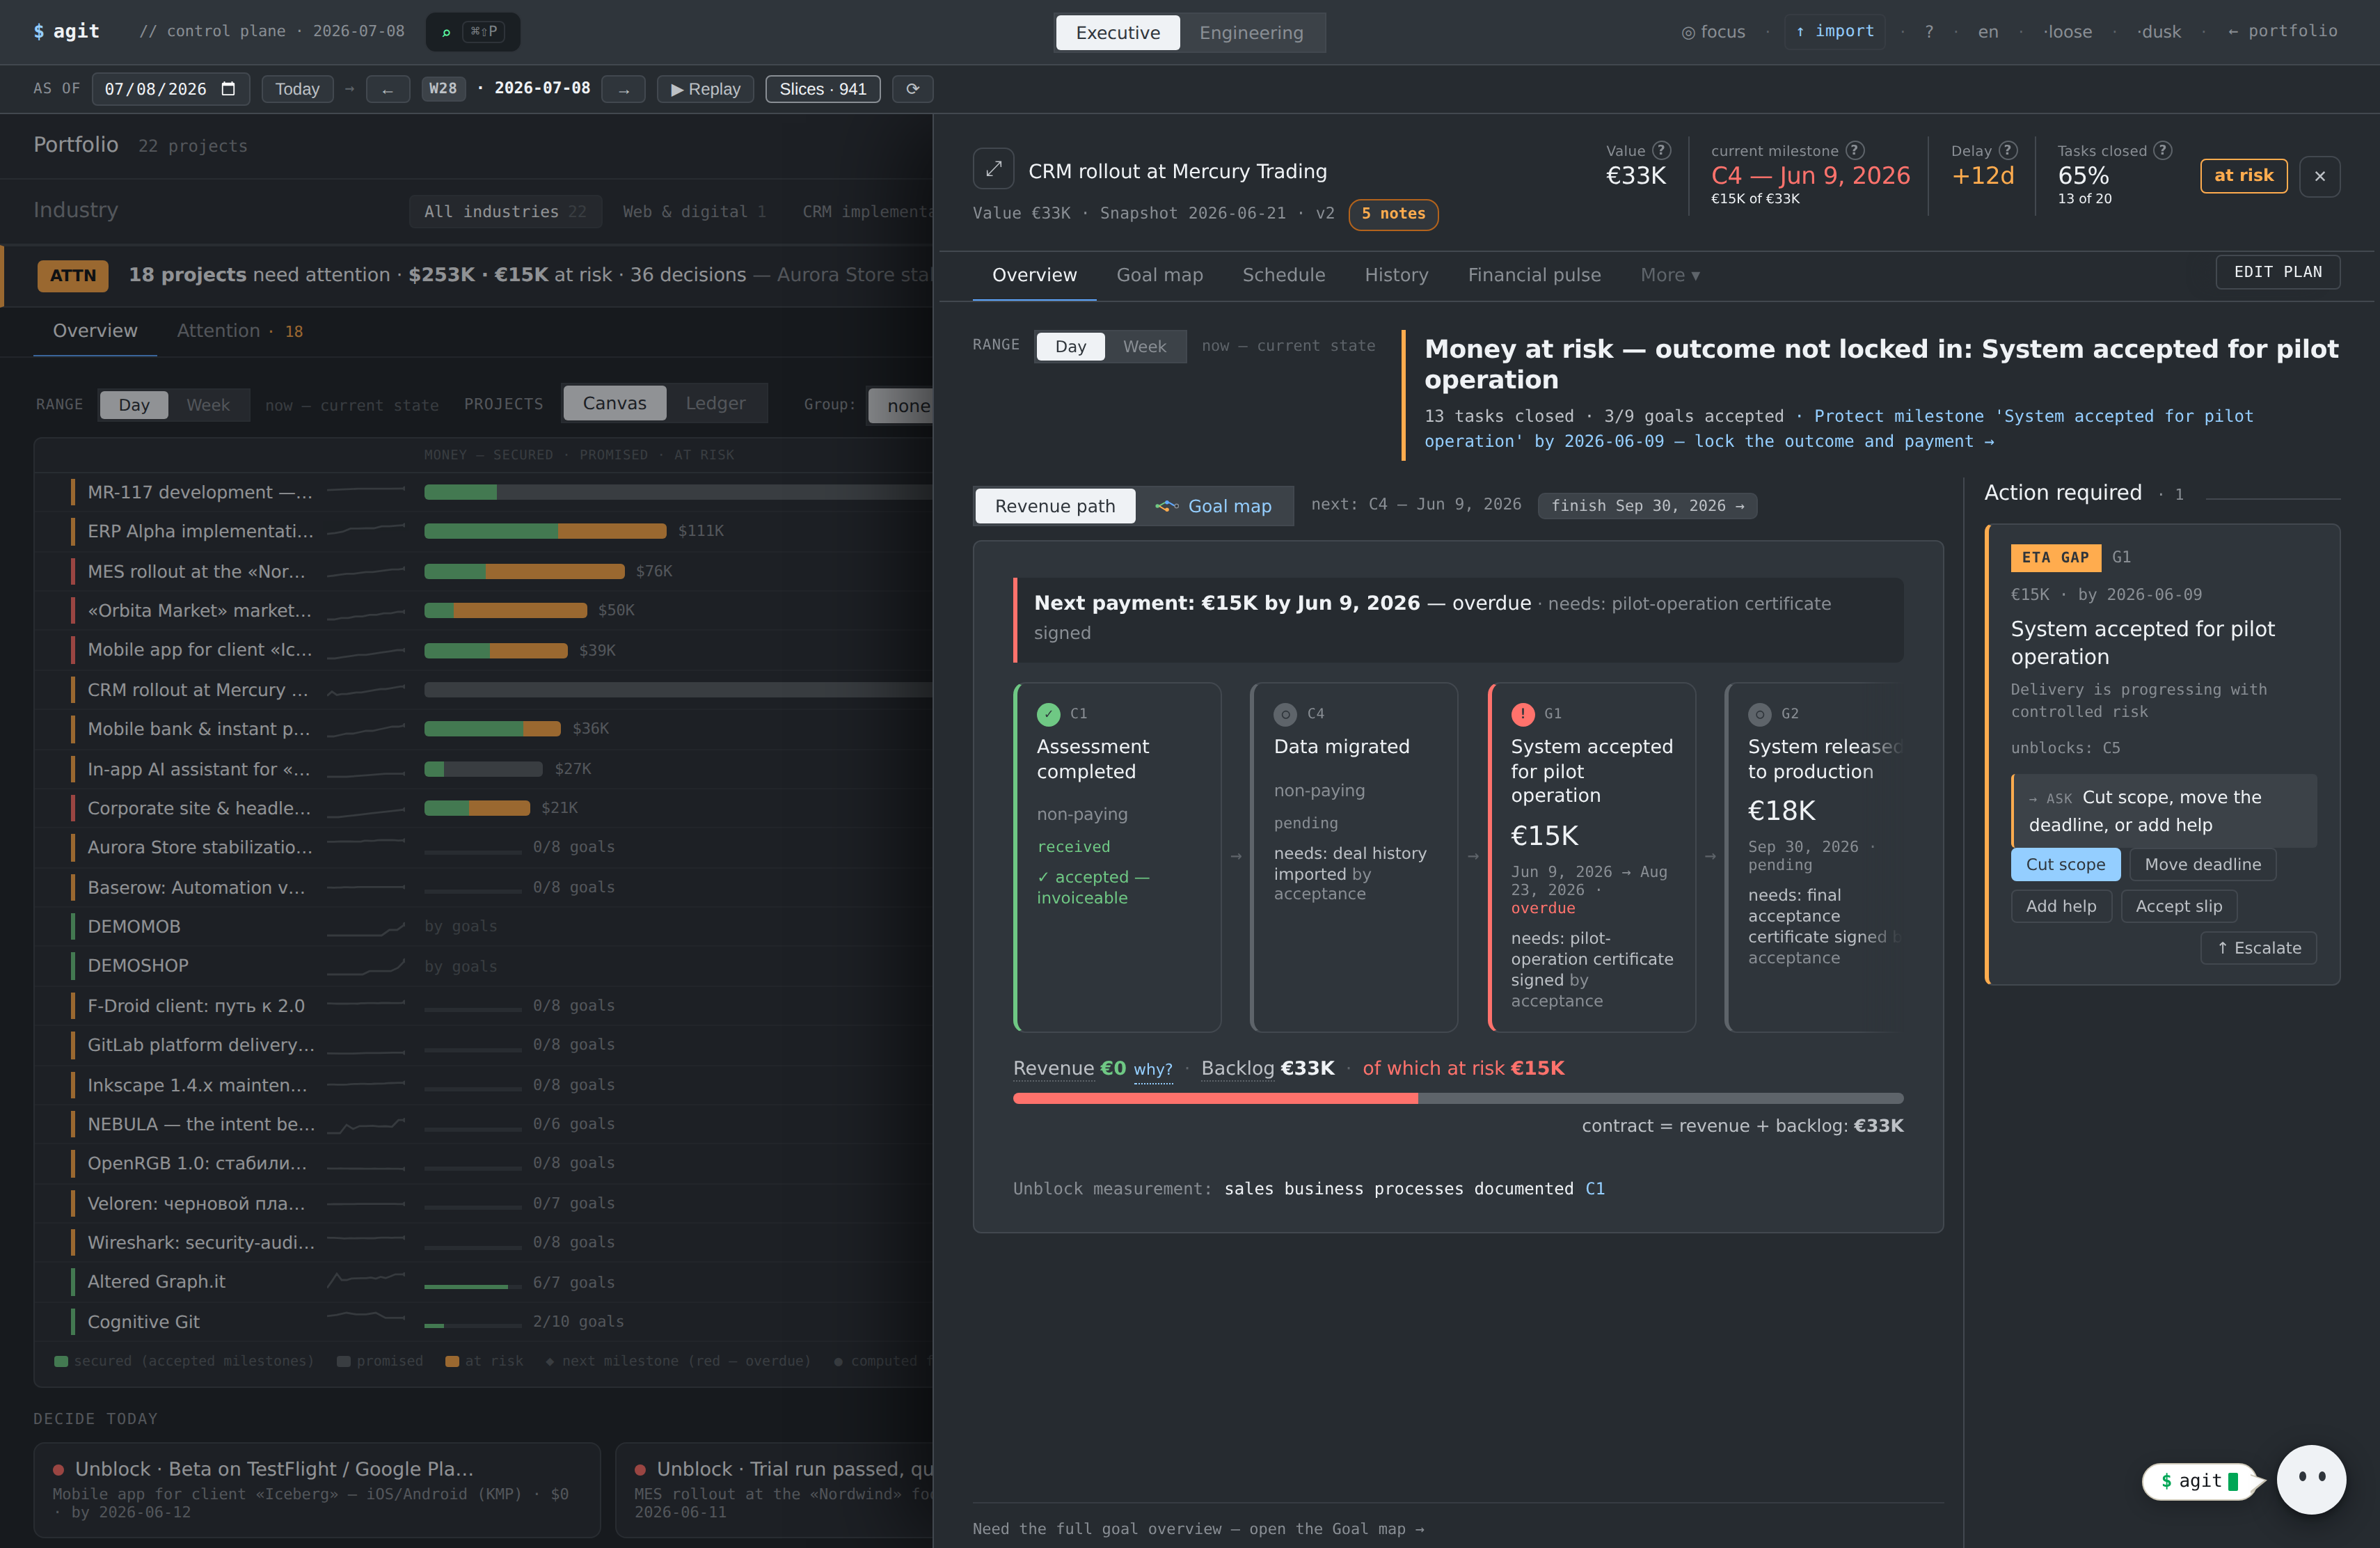
The verdict, right in the header: “Money at risk — outcome not locked in”. The revenue path as a staircase of milestones. At the bottom: Revenue 0 ₽ · Backlog 3.3M ₽ · of which at risk 1.5M ₽.

What you get

You grasp the cause instantly: the pilot-operation milestone worth 1.5M ₽ is overdue and needs a signed act. And you see the options right there: cut scope, move the deadline, add help, accept.

5
Step 5 · Project → Financial pulse

The cash truth of the project

altered-graphit.com · Project → Financial pulse
The cash truth of the project
What you see

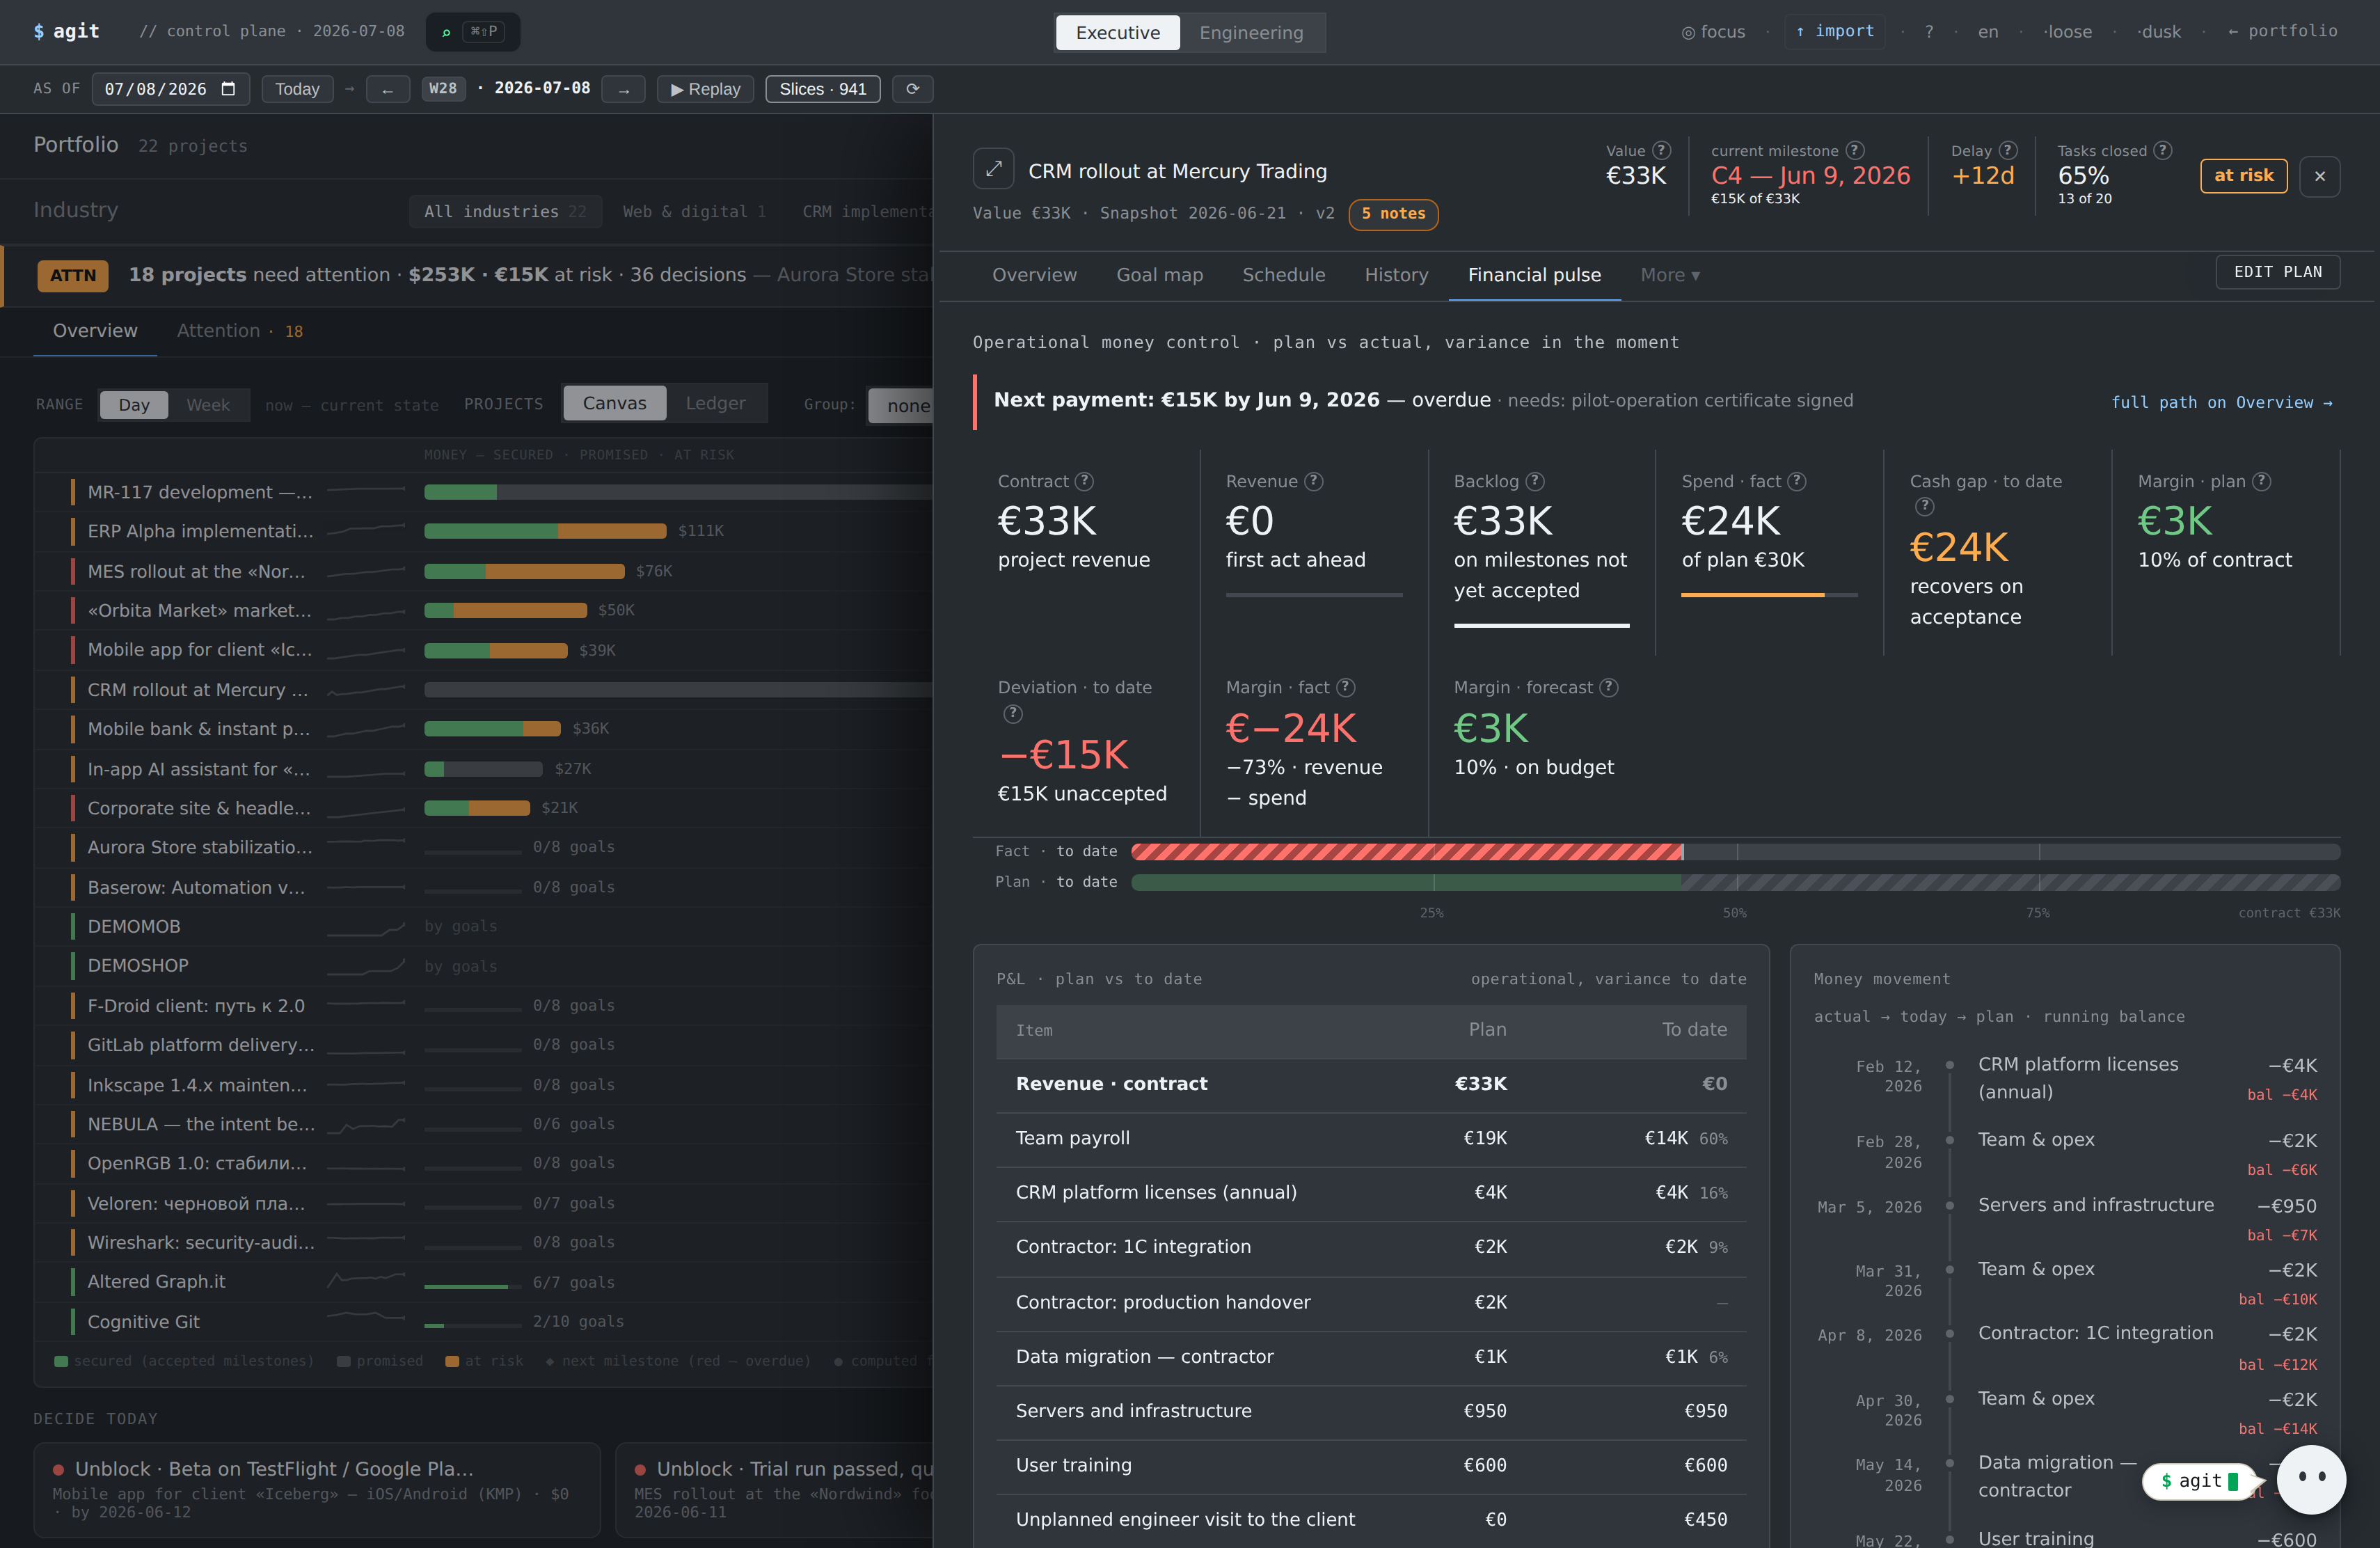
Inflows (plan) 3.3M ₽ · Received 0 ₽ · Deviation −1.5M ₽. A monthly inflow chart (plan vs actual) and a deviation table by milestone.

What you get

In black and white: not a single ruble is closed by an act yet, even though the project is 60% done. That's the cue to talk acceptance with the client — before quarter-end.

6
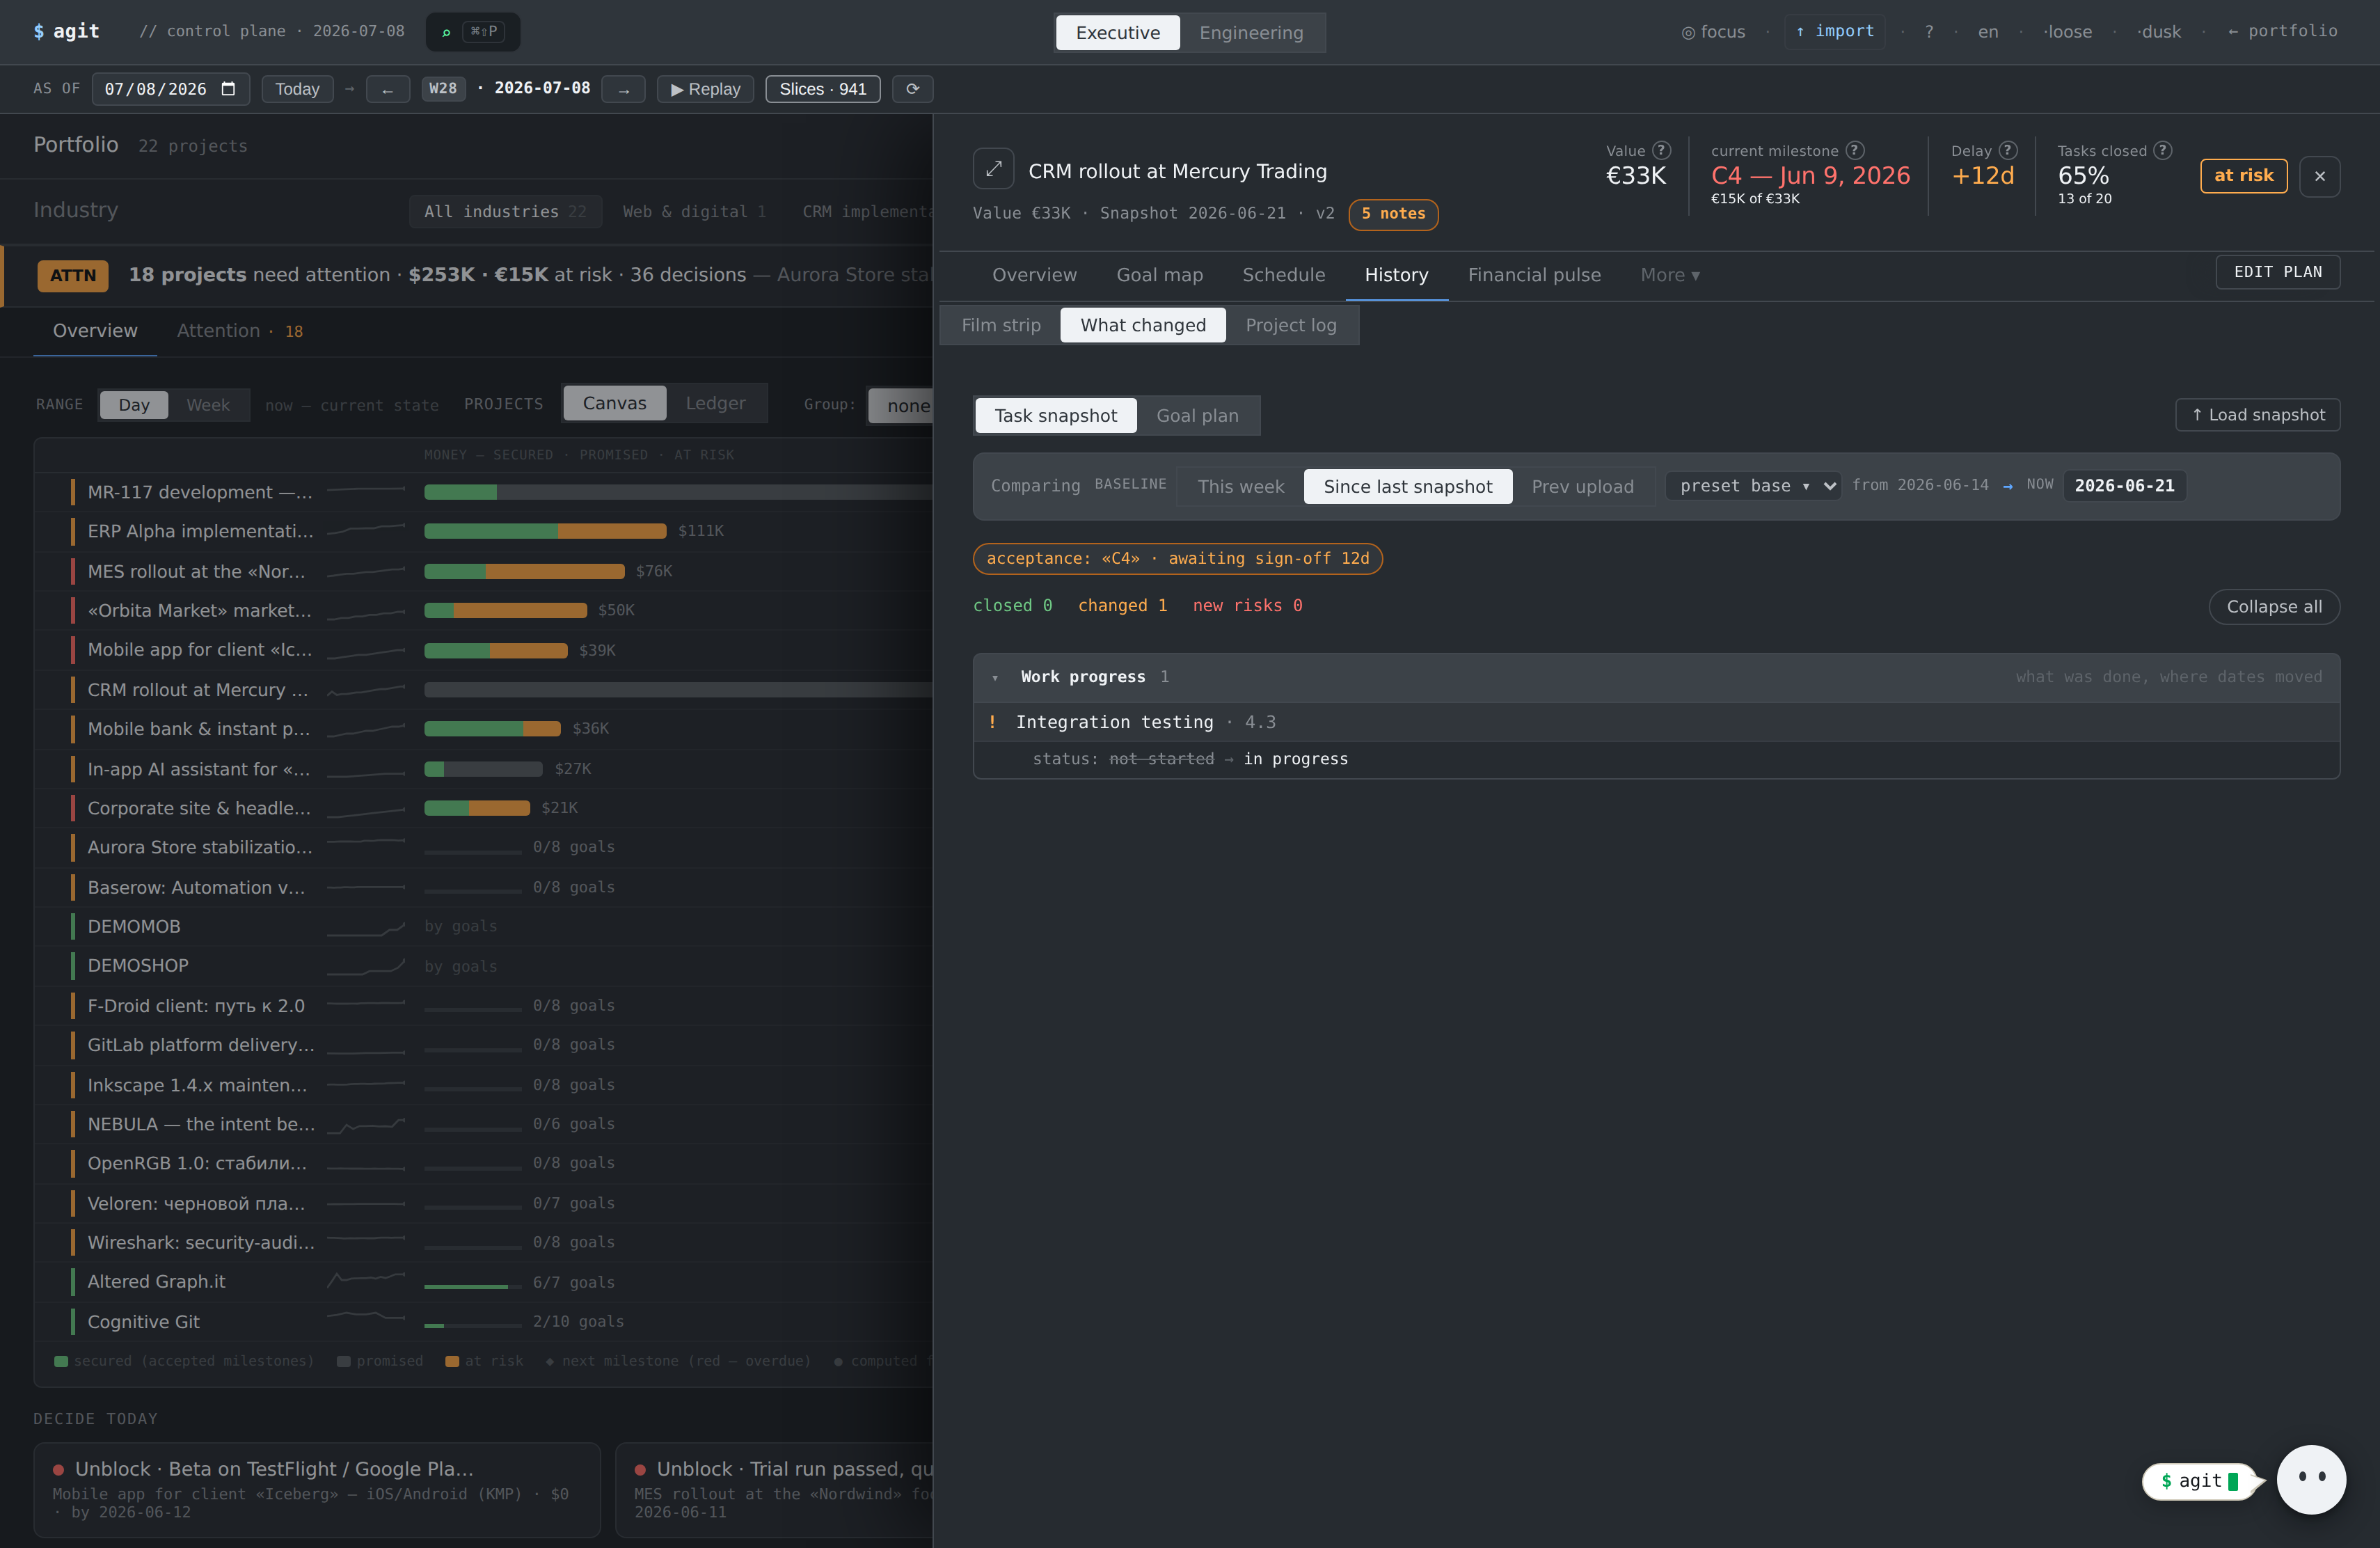
Step 6 · Project → History → What changed

Trust in the status: changes backed by facts
altered-graphit.com · Project → History → What changed
Trust in the status: changes backed by facts
What you see

The diff between two snapshots: what's achieved, what slipped, which signals arrived (e.g. “client scheduled acceptance for June 20”). Every change with an actual date.

What you get

The status is trustworthy — every change stands on a fact or a signal, not on “we think it's done”.

7
Step 7 · Project → Goal map

The critical path to the money

altered-graphit.com · Project → Goal map
The critical path to the money
What you see

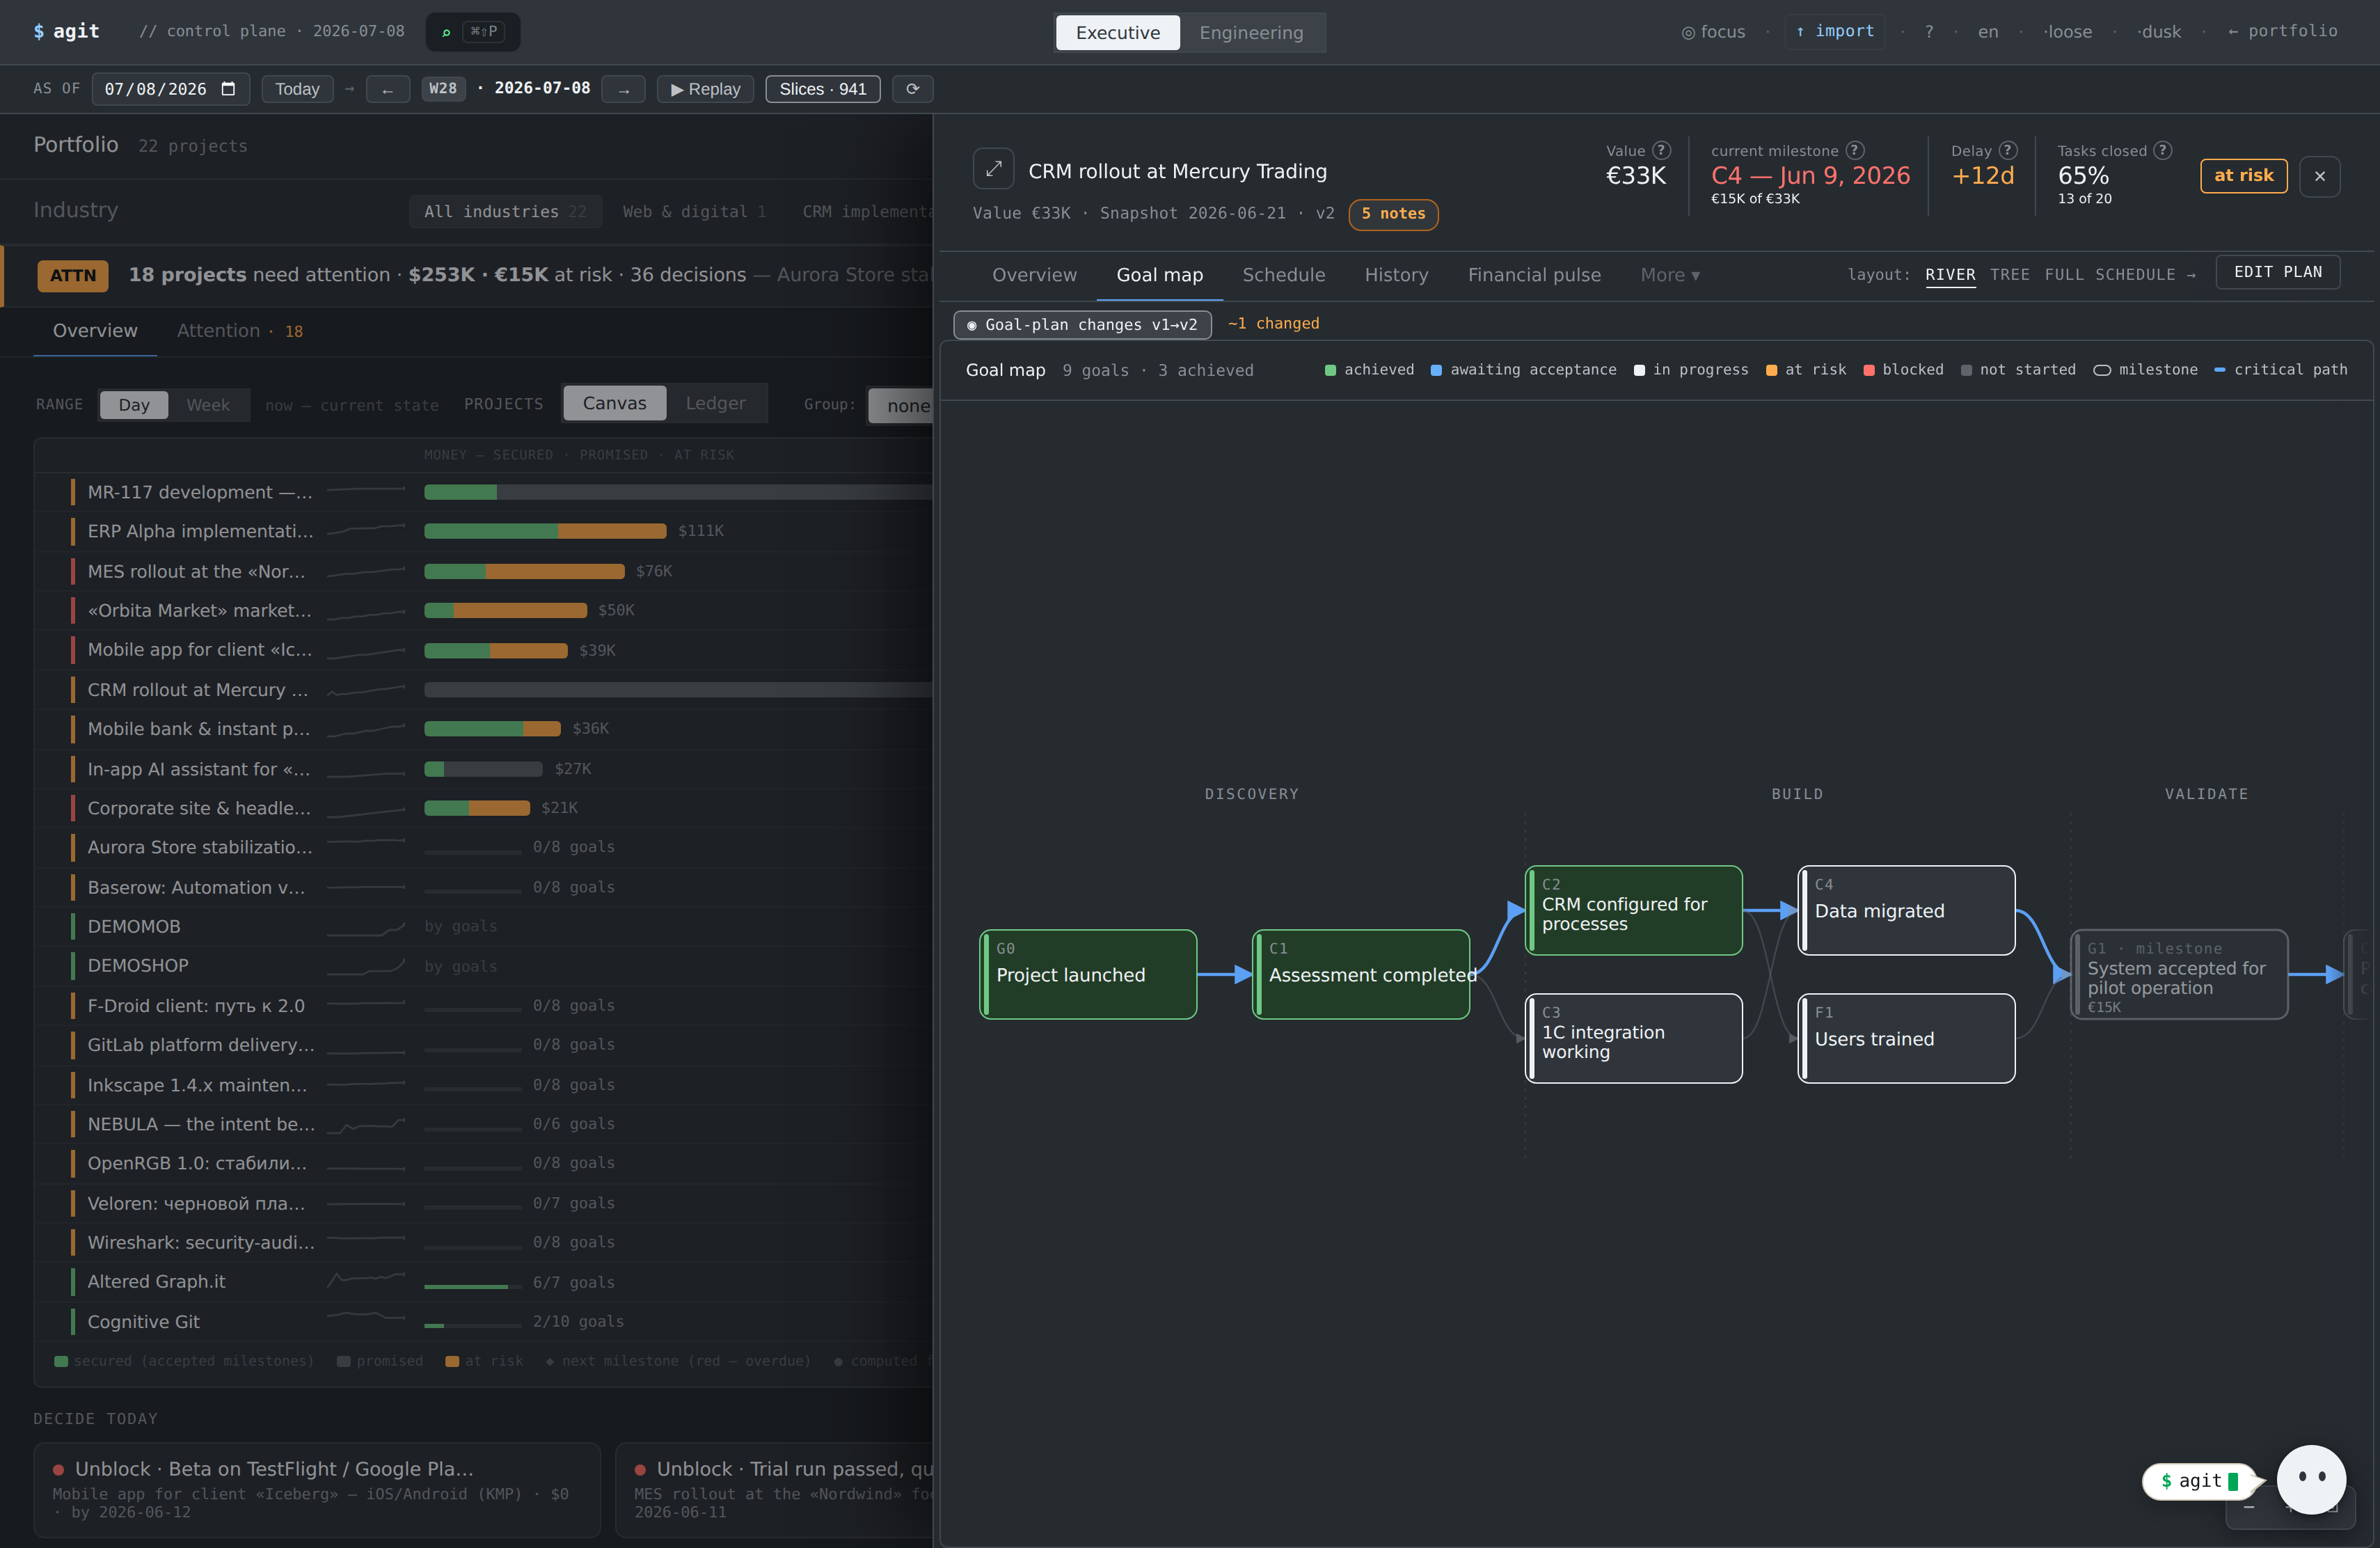
A goal graph by phase: Prep → Build → Verify → Launch. The “System accepted for pilot operation” milestone (1.5M ₽) is flagged at-risk on the critical path.

What you get

You see the exact node holding 1.5M ₽ and what unblocks it — you can push on that specifically, not “speed everything up”.

8
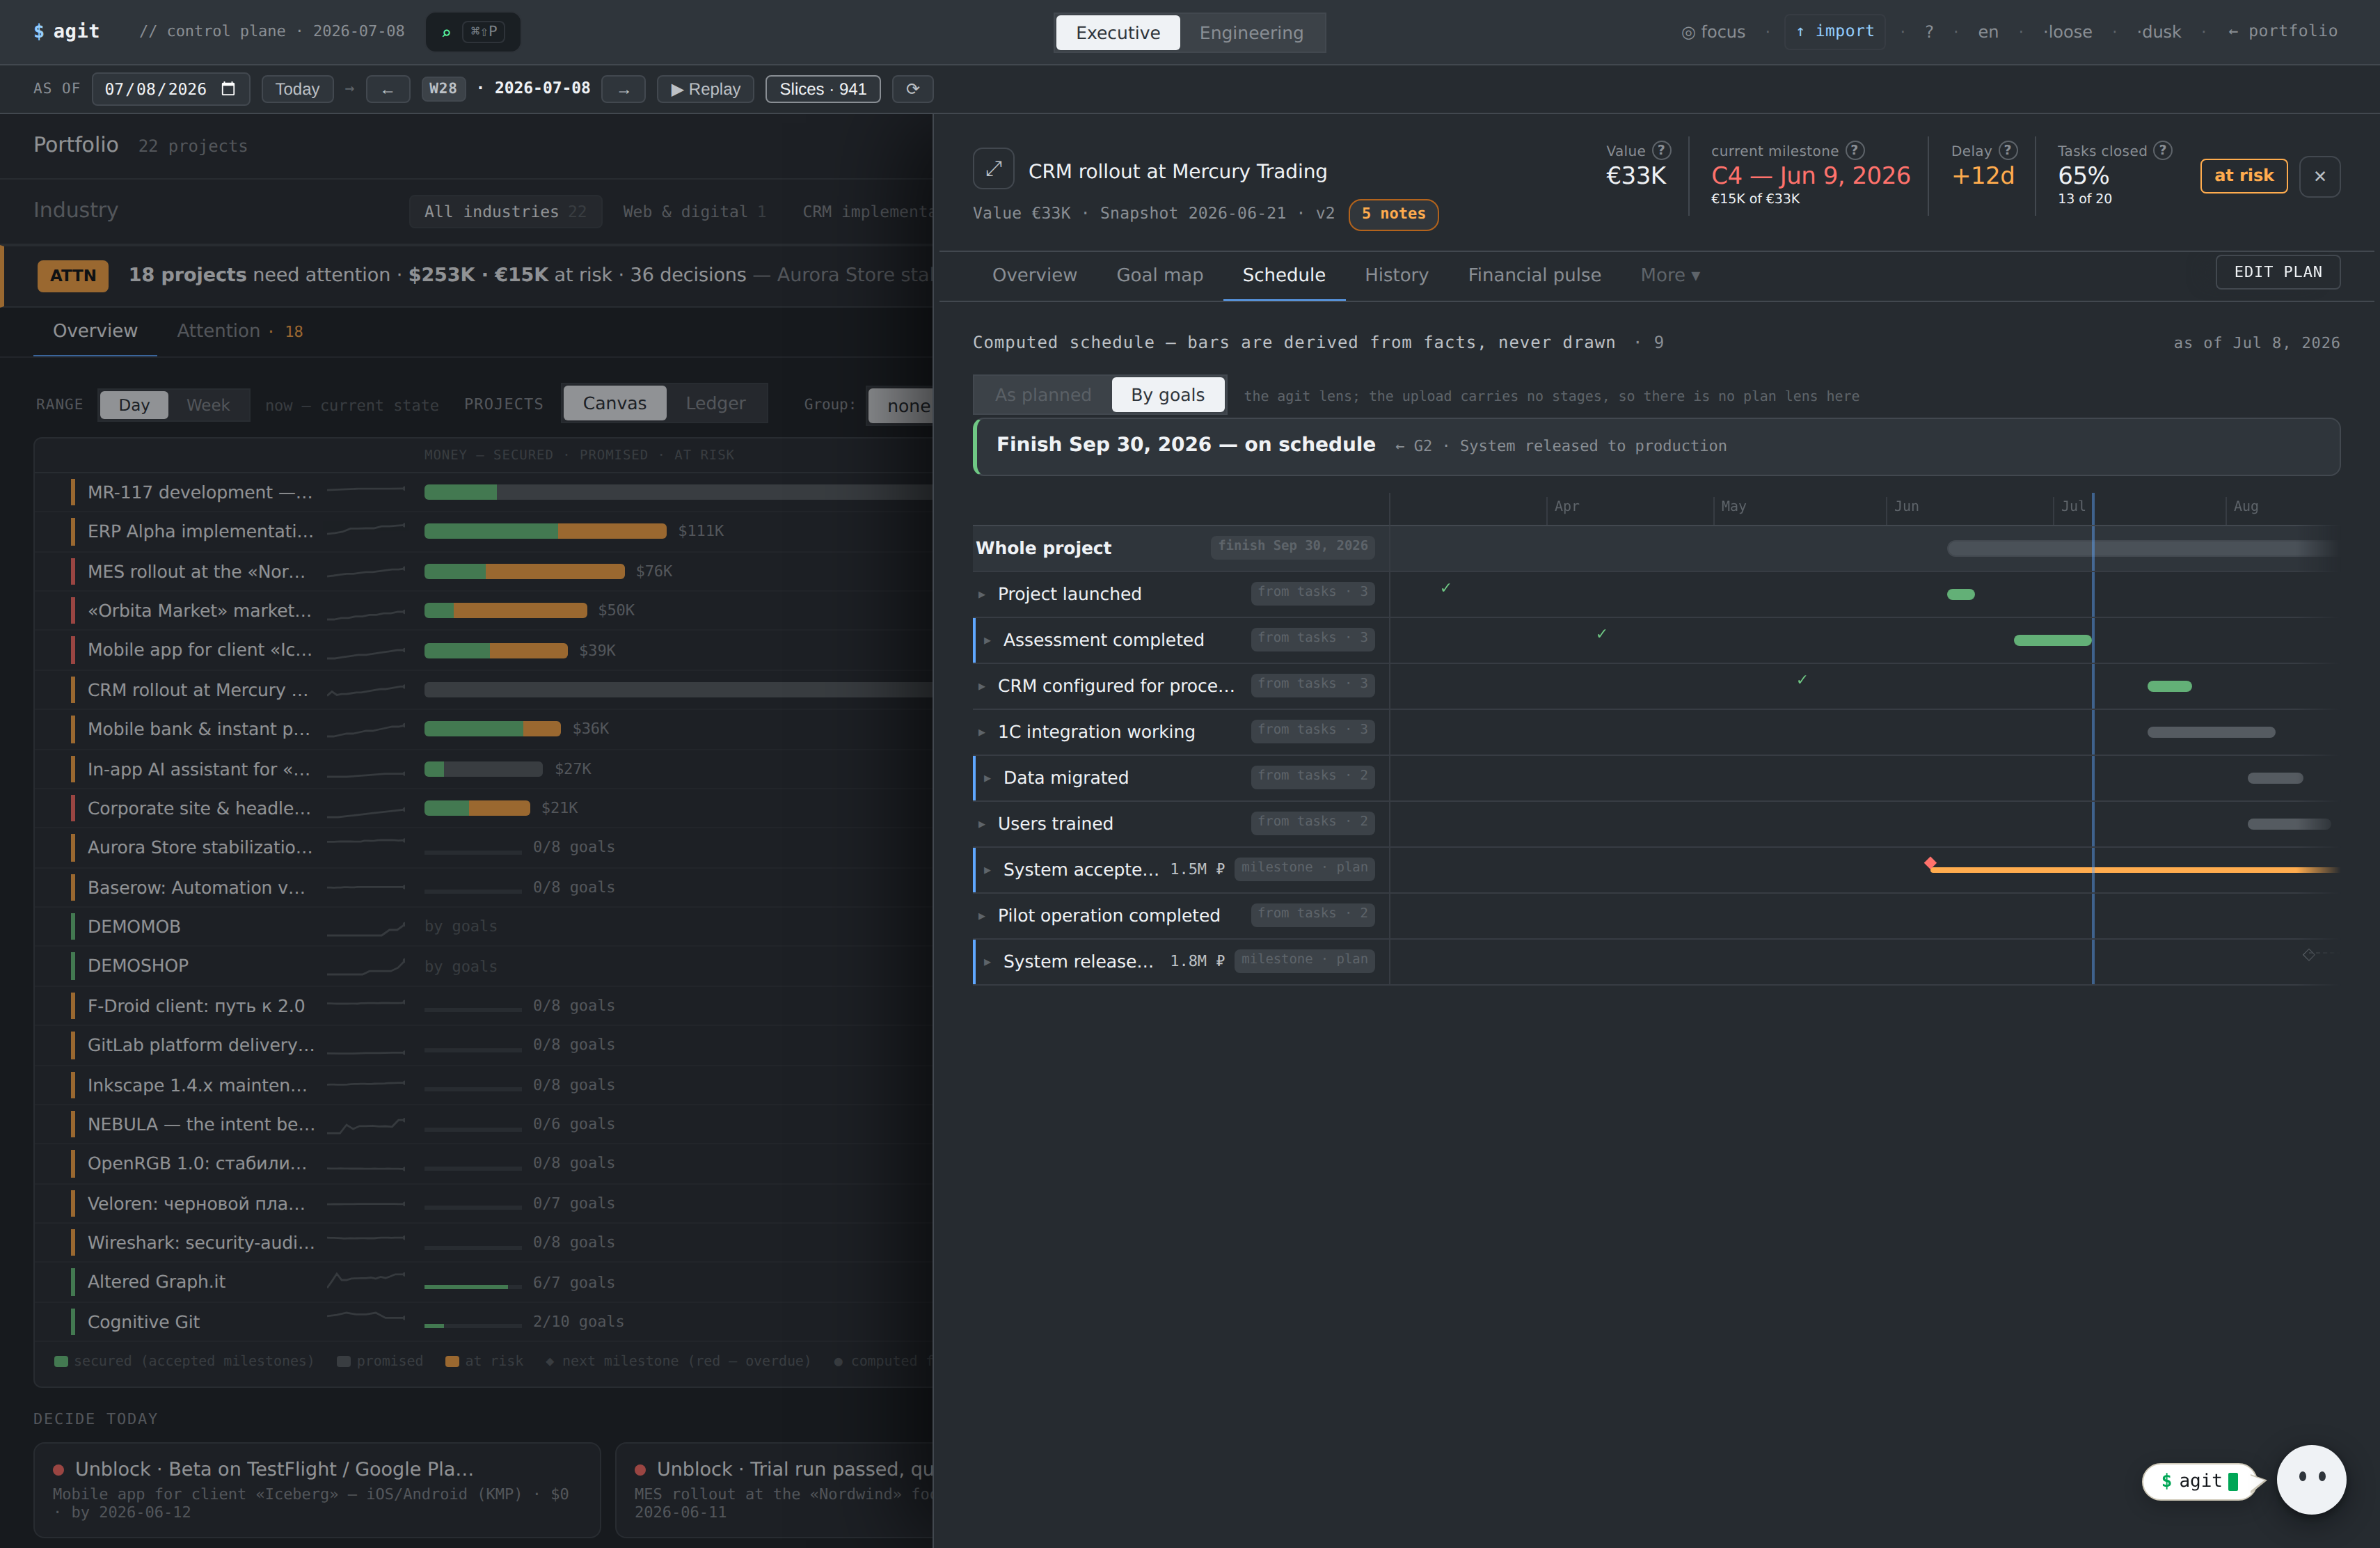
Step 8 · Project → Schedule

When is the finish — and which task holds it
altered-graphit.com · Project → Schedule
Computed schedule: when is the finish and what holds it
What you see

A computed schedule: a verdict on top — “finish Sep 30, 2026 — on schedule” (or “slipped by +N days”, with the culprit). Bars are derived from facts — milestone plan dates ◆, task date windows, forecasts; every lane carries its source badge: “milestone · plan”, “from tasks · N”.

What you get

The familiar Gantt read — except it can't be drawn, only computed. A bar edge clicks through to the task that holds it: the schedule conversation is concrete from the first minute.

9
Step 9 · Portfolio → As of (time-travel)

Rewind two weeks — and prove it

altered-graphit.com · Portfolio → As of (time-travel)
Rewind two weeks — and prove it
What you see

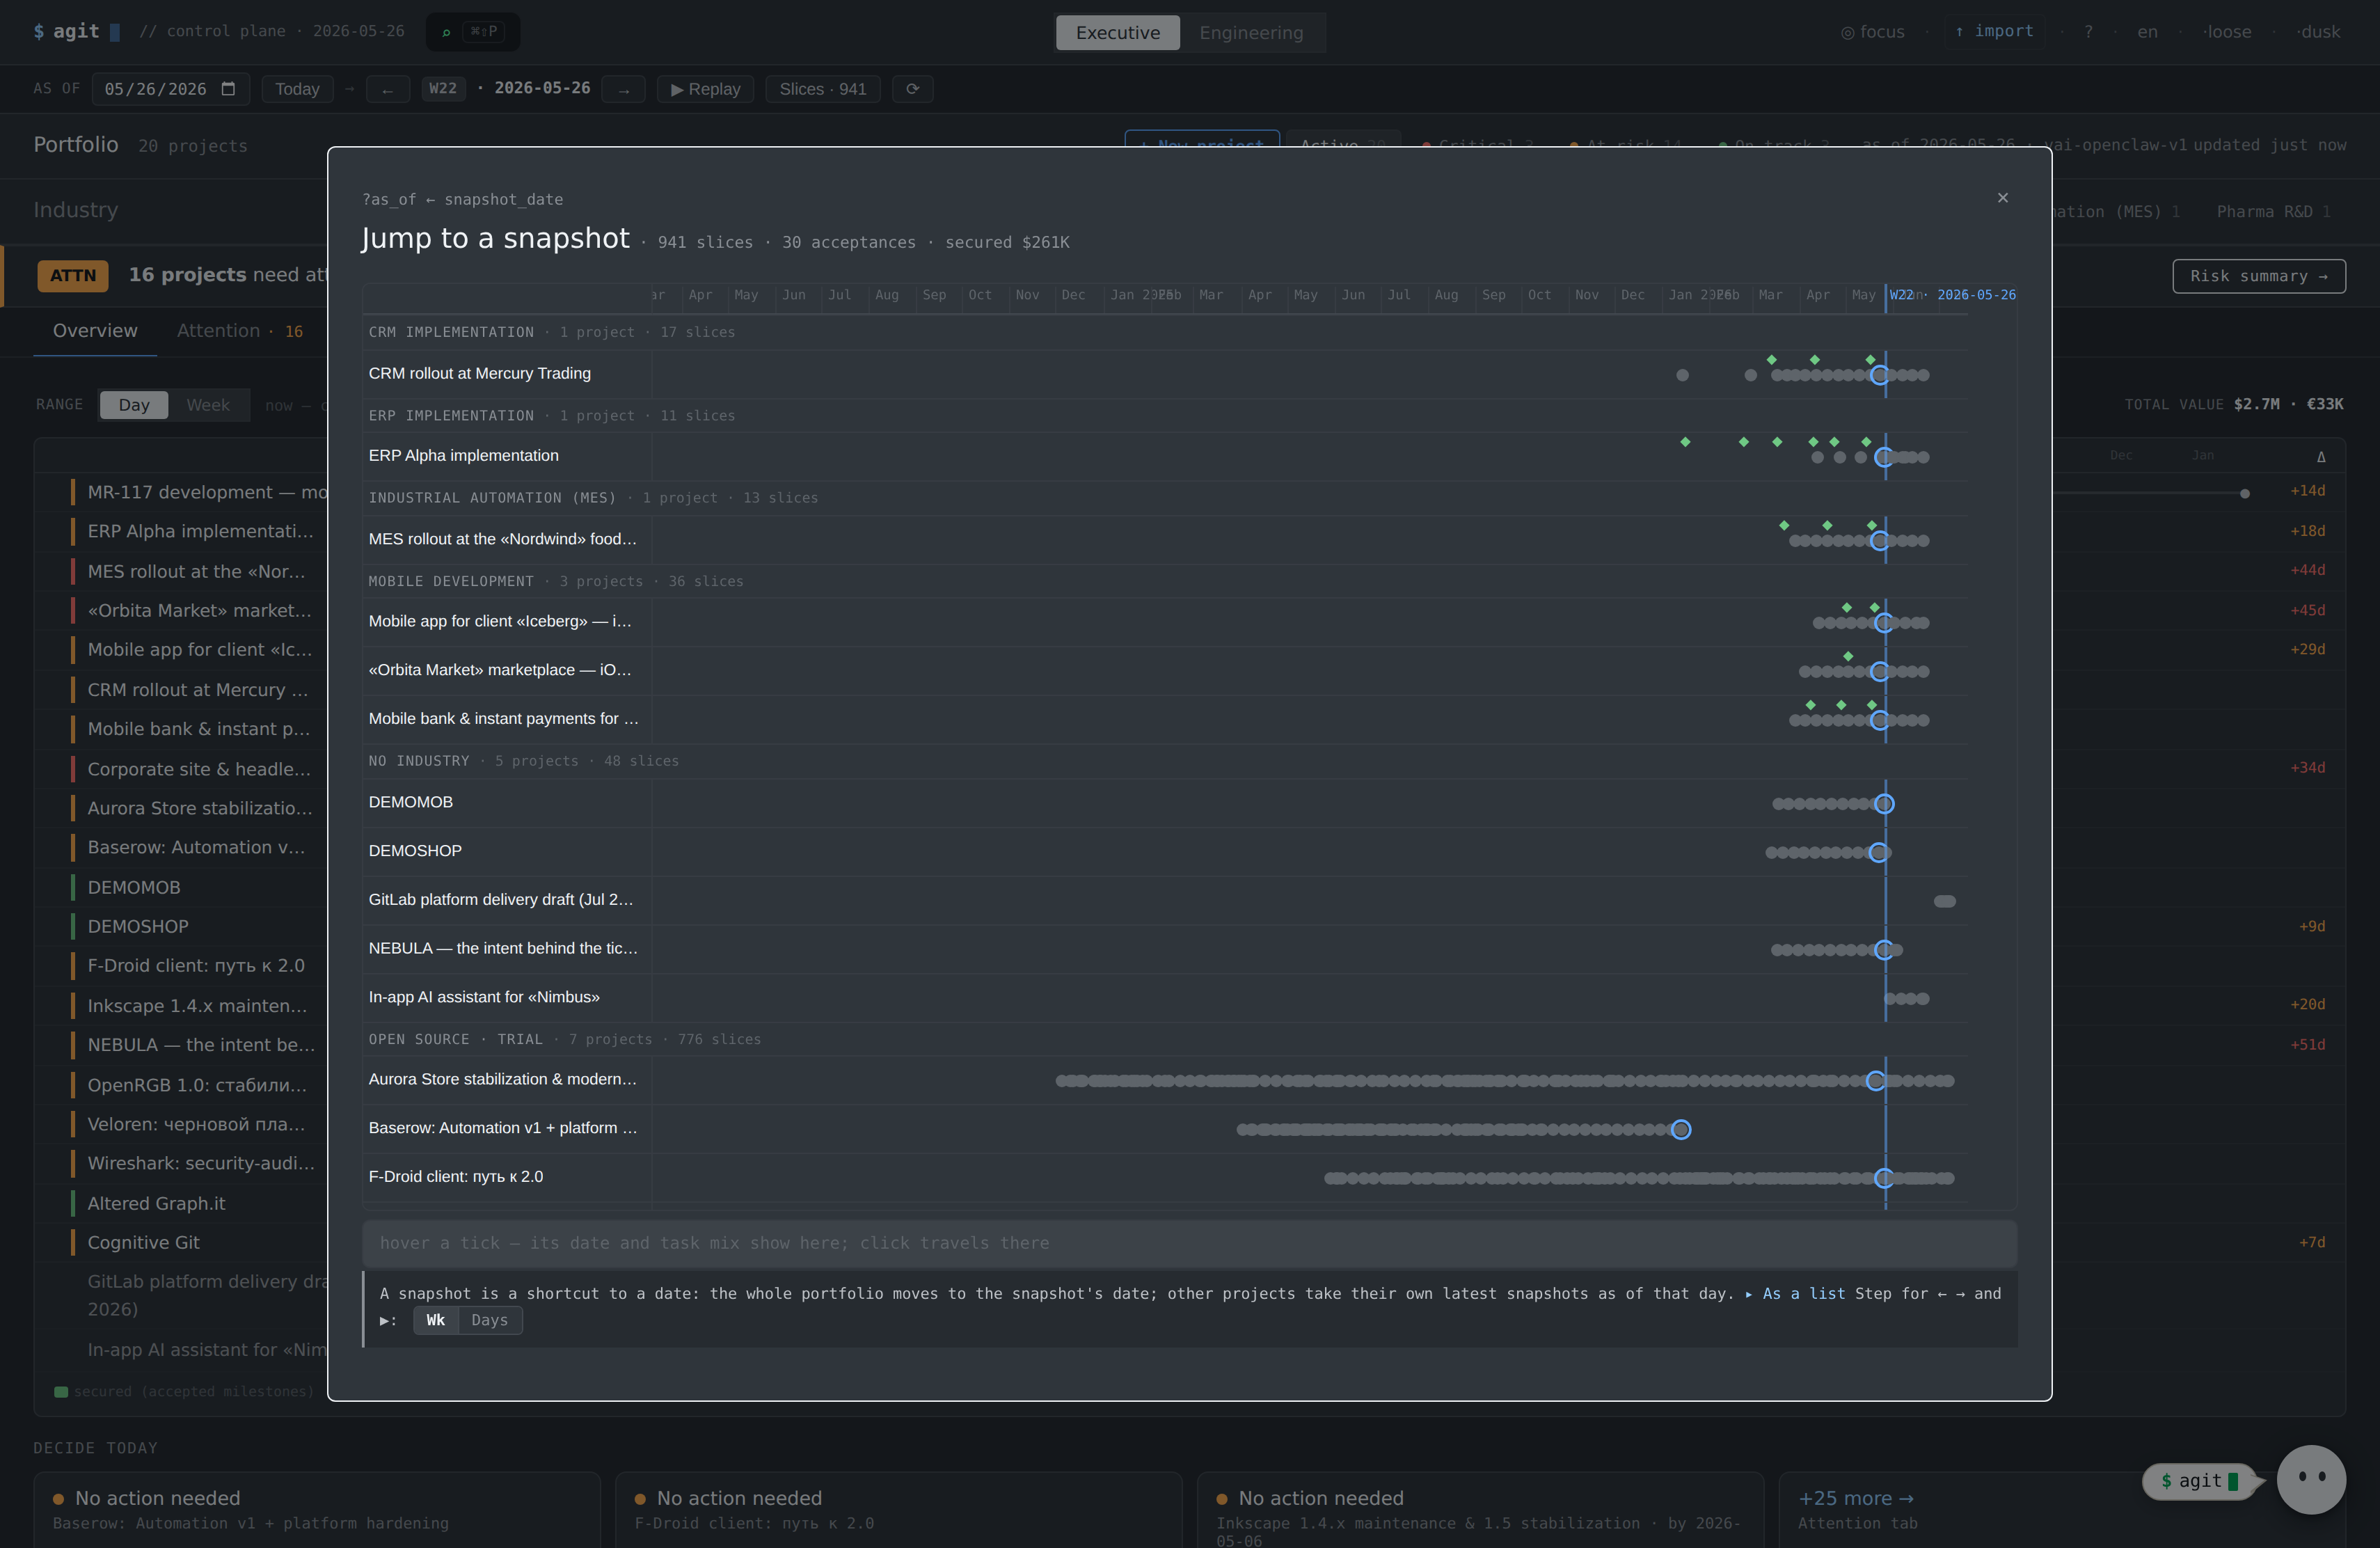
The portfolio as of June 24 — exactly as it was. On top, the slice map: the whole observation history, a tick per snapshot, ◆ on acceptance dates. Clicking a tick moves the whole portfolio to that date; a step takes about a second.

What you get

State is reproducible. You can rewind and show the client or the team exactly when and what slipped — no “did it really” argument.

10
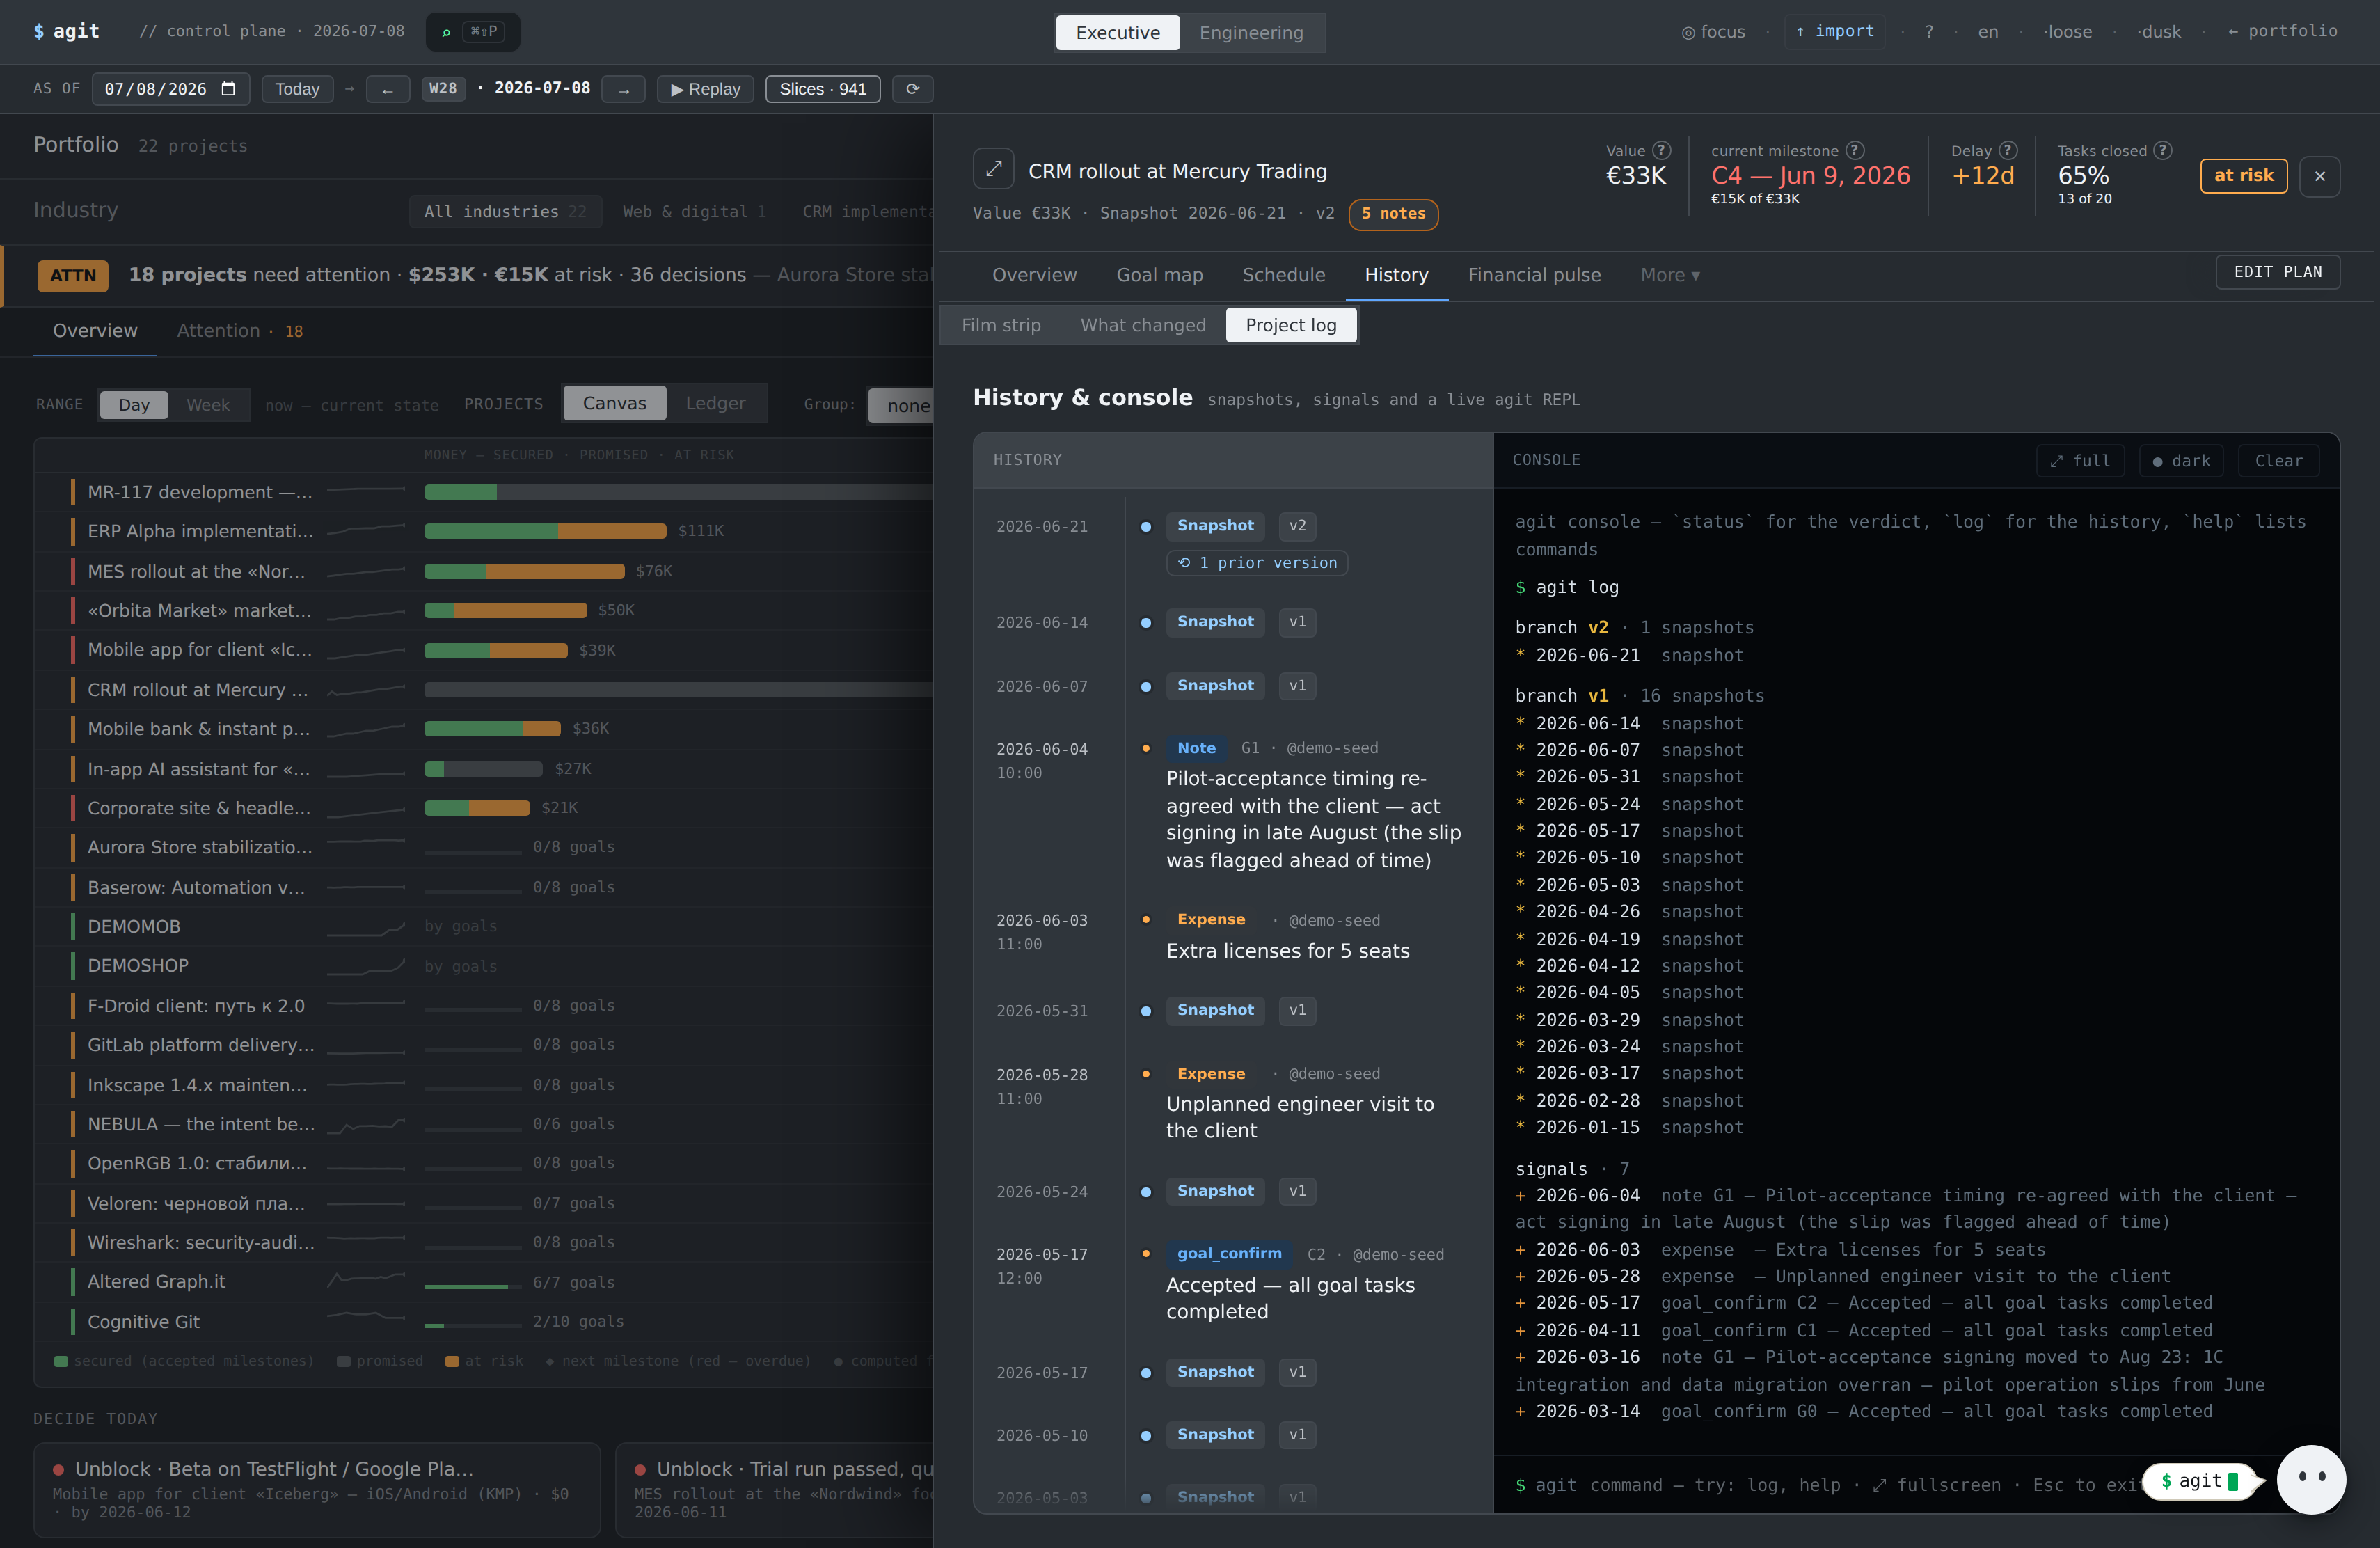
Step 10 · Project → History → Log (acceptance journal)

The evidence: the acceptance log

altered-graphit.com · Project → History → Log
The evidence: the acceptance log
What you see

History on the left: plan snapshots and acceptance confirmations with dates — “accepted, all milestone tasks complete”. The same log in a console view on the right.

What you get

An append-only audit trail: entries aren't edited — changes are added as a new event. Every accepted milestone = money, with a date and a basis. This is what separates AG.it from a task tracker.

11
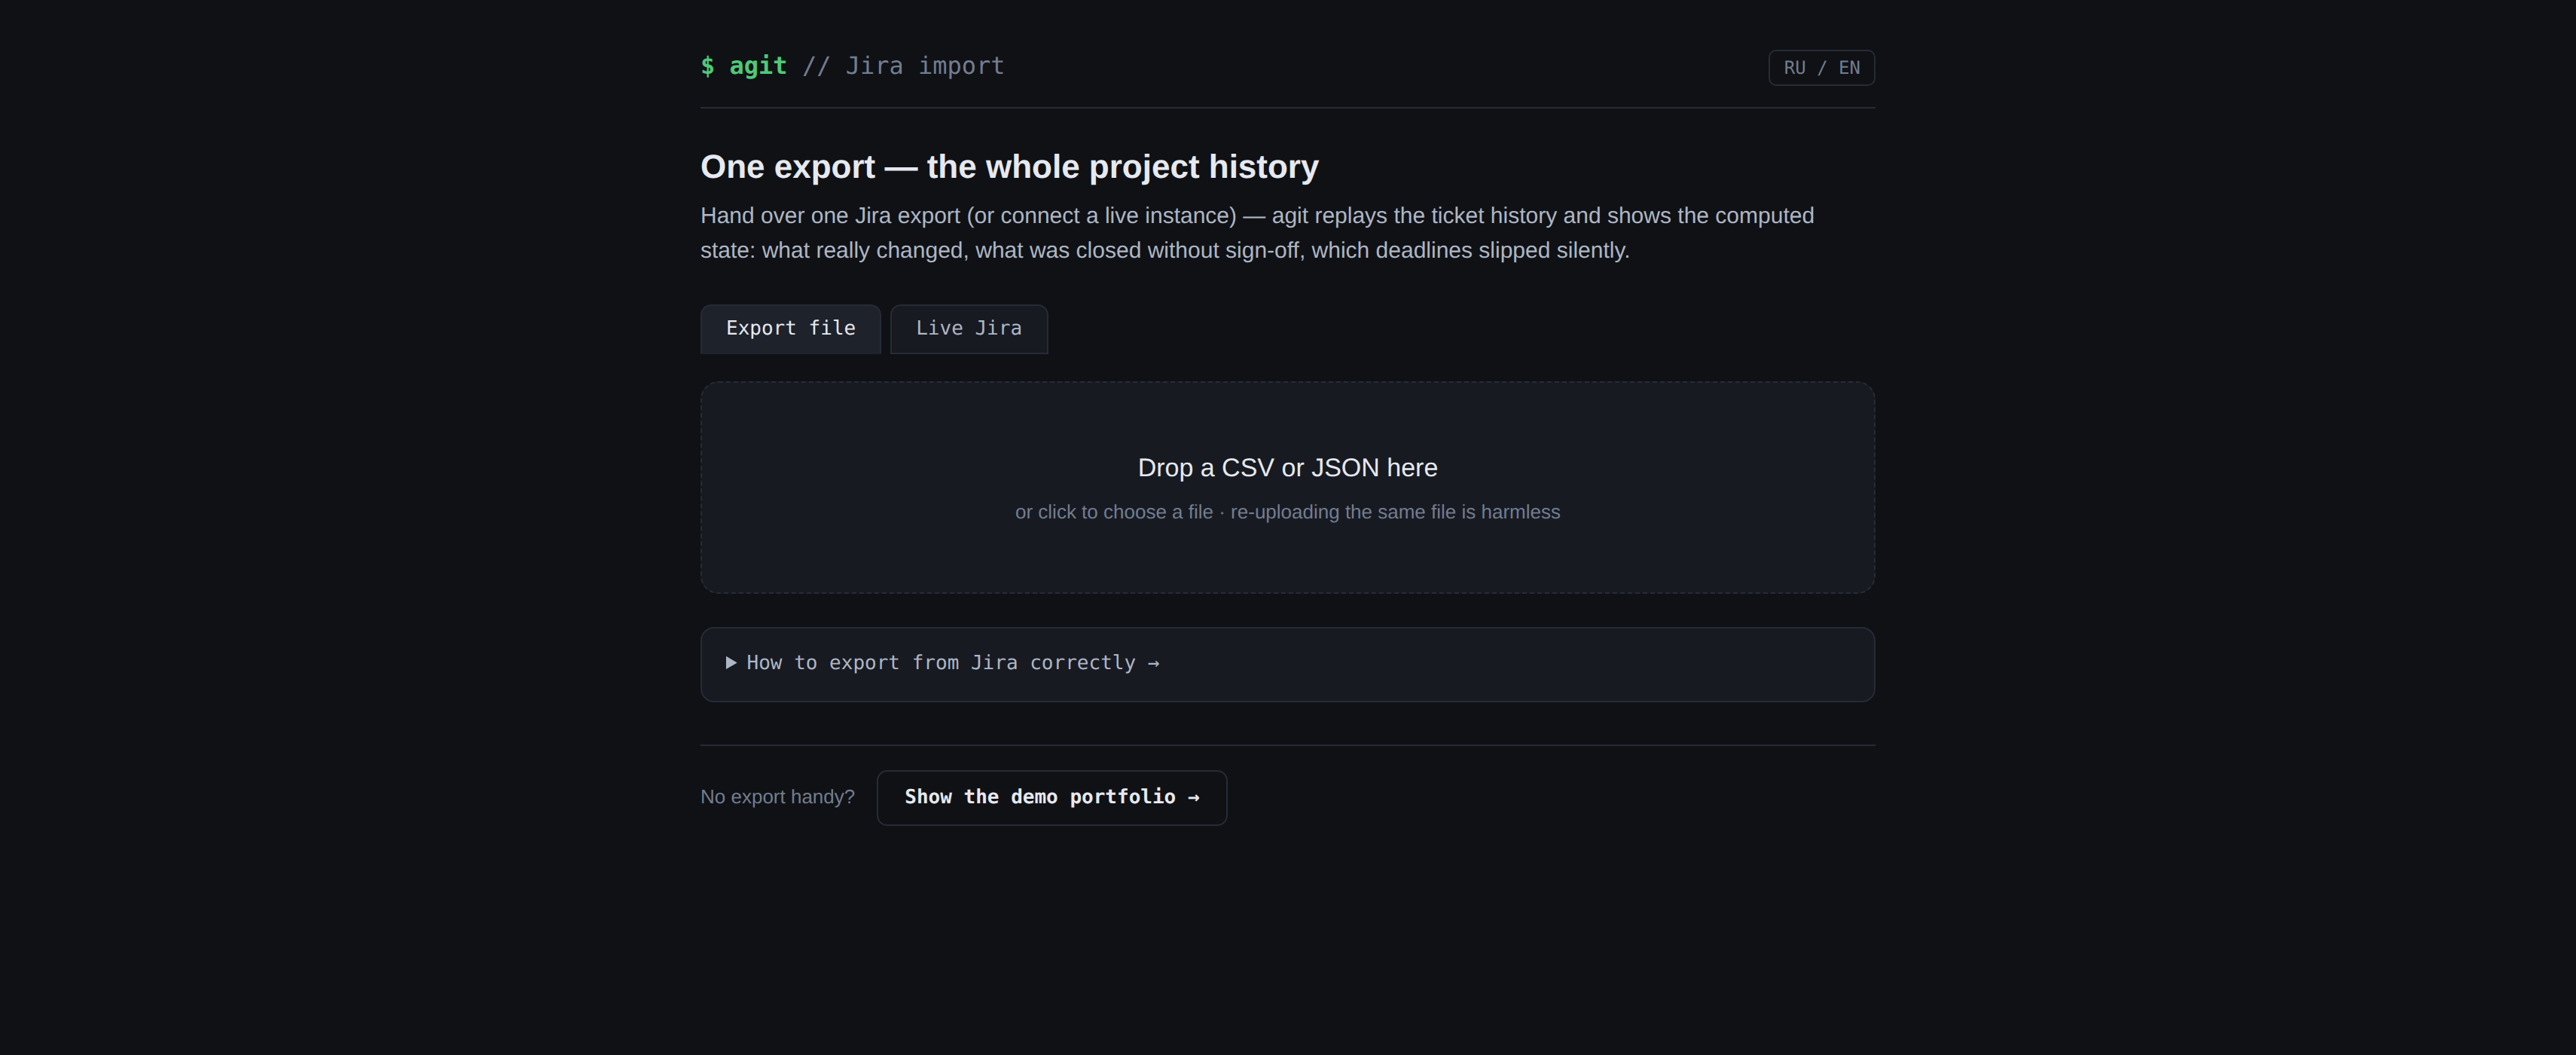
Step 11 · How to start

Where does the data come from? First technical snapshot in ~10 minutes
altered-graphit.com · How to start
Where does the data come from? First technical snapshot in ~10 minutes
What you see

Import a task snapshot from Jira / Excel (CSV or XLSX) — the system builds the state at once: progress, overdue, diff. The goal graph and money come later.

What you get

The main objection — “who is going to fill this in” — is gone. The first report lands on day one, no long rollout; the data comes from what the team already has.

What changes for the owner

BeforeAfter
Portfolio status assembled by hand for MondayUp to date as of the latest snapshot; real-time at implementation
Acceptance slip surfaces after the factVisible early, with the amount at risk
“80% done” — and no money inRevenue / backlog / at-risk — in rubles
A meeting about “who did what”A meeting about decisions on specific milestones
The team's status taken on trustStatus proven by facts, signals and the acceptance log
Where to start: show this to your delivery lead or the owner of one problem project — where money is already stuck on acceptance. One such project pays for the rollout.

If you meet a term

Snapshot — a snapshot of the project's tasks on a date; state is computed from it — like a build from a commit.
Milestone — a goal with money and a deadline: its acceptance is what gets paid, by act.
Revenue / Backlog — money on accepted milestones (act signed) / on not-yet-accepted ones (pending acceptance criteria).
Pilot / production operation — typical acceptance stages in an implementation project.
Acceptance confirmation — a record that a milestone was accepted (in the acceptance log), with a date and a basis.
Diff — what changed between two snapshots: what's done, what slipped, what's at risk.