You pay for your team's work. What actually turned into a tangible result?
AG.it ties your team's work to the results you actually get: each week you see what's already confirmed by facts, what's still only promised by the plan, and where work was done but produced no result.
Manage your team's work like you manage code.
Declarative goals in YAML, task snapshots from your tracker, a clean diff every time data changes. See which goals your team's work actually moved — no standups required.
goals.yaml— declarative goal graph, versioned like codesnapshot.csv— every task linked to a goal on any given datediff— what moved, what stalled, what needs a decision — per goal
AG.it (short for Altered Graph.it) — the control plane; $ agit in the terminal.
What it is
Altered Graph.it is a control plane for projects — it computes the real state of a project from facts and shows why it is the way it is. Not another tracker, not an activity dashboard. AG.it works on top of how you already run projects: it takes goals, task snapshots, statuses, acceptances and dependencies, and turns them into an evidence-backed state of the project.
A declarative goal plan
Goals and acceptance criteria are defined separately from tasks. The plan is kept as code: you can version it, diff it and rebuild it — no manual magic in reports.
Facts from execution
Tasks, statuses, acceptances and dependencies load from your tracker, Excel or CSV. Every unit of work is tied to the result the team is working toward.
An honest diff
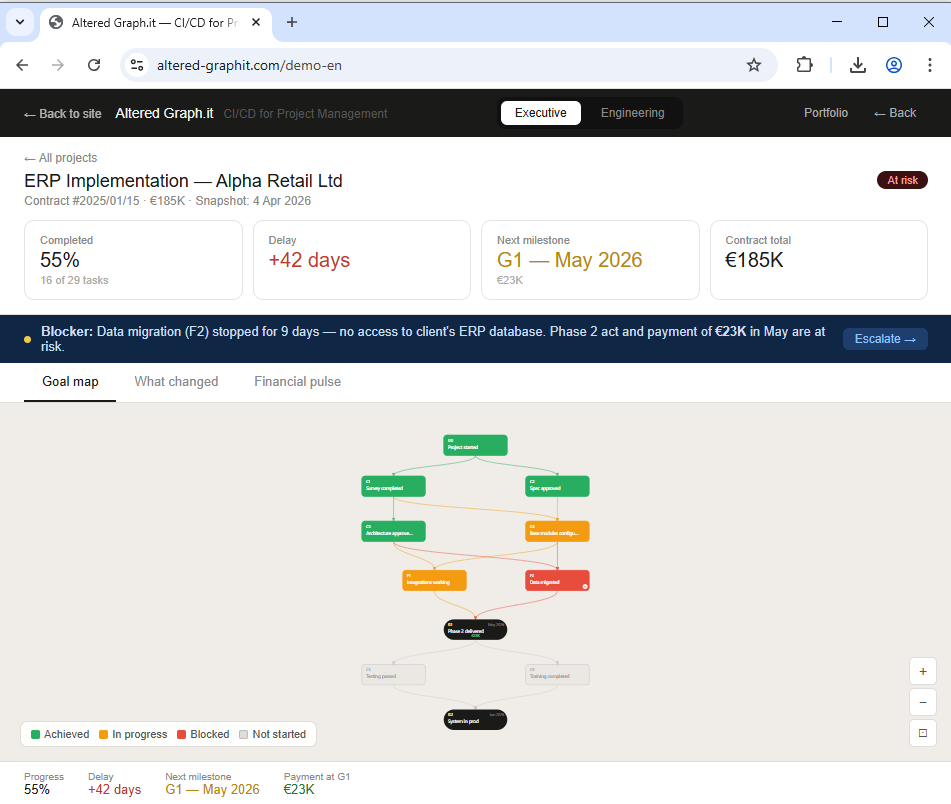
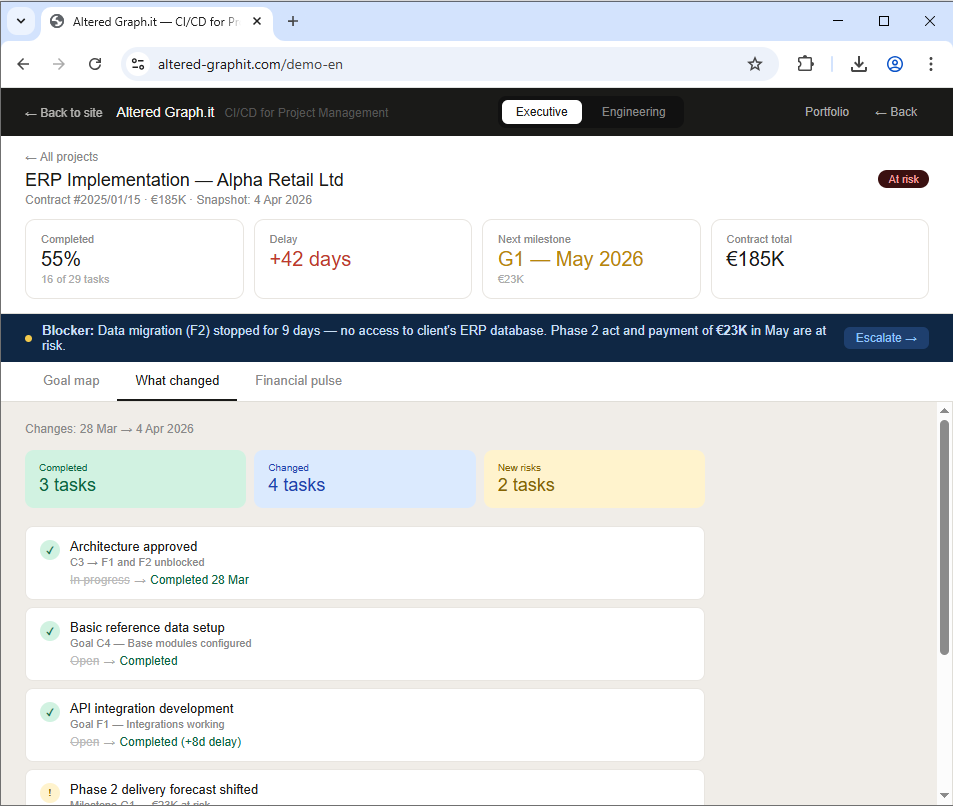
AG.it compares snapshots and shows what actually changed: which result is confirmed by facts, what is only expected per the plan, where a blocker appeared, and what decision is needed.
How it works
Live demo
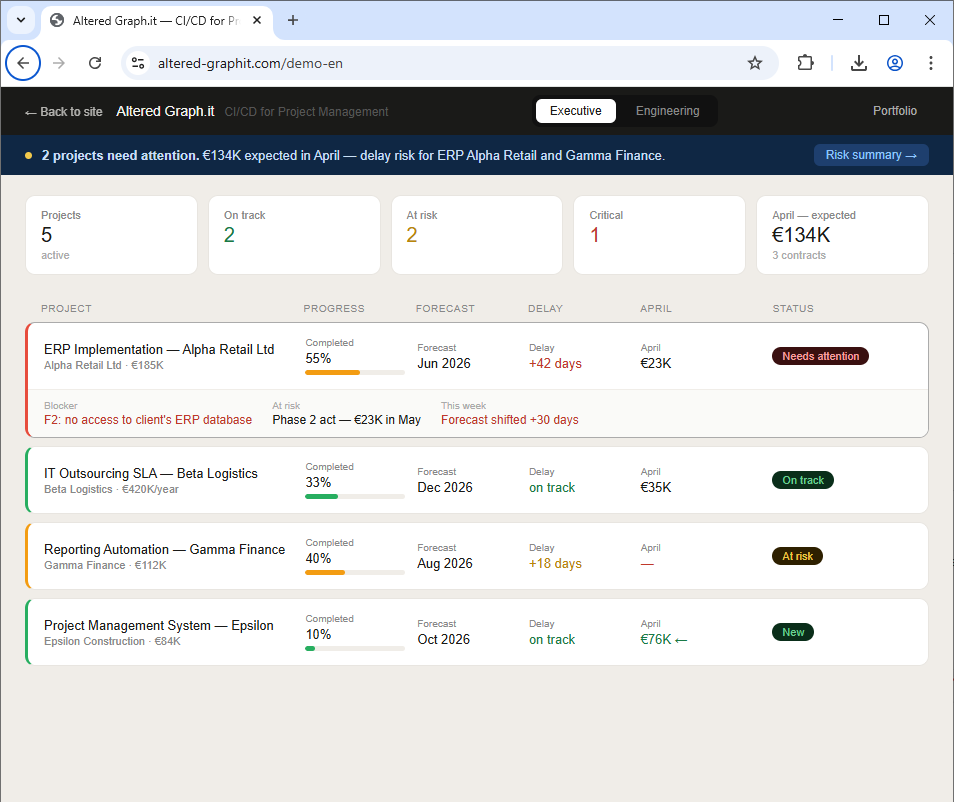
A real weekly review on sample data — not a screenshot. Open a project, see what changed since the previous snapshot, see what needs a decision.
This is a live system. Every click and drill-in works.
What you get
Use cases
Guided walkthroughs on the live demo data — pick your role. Each one opens in your language.
One screen: money, risk, control
The product on one screen — the short version, no ten-step tour.
Open →Where your money is in the projects
Money, risk, delivery control — and the decisions that actually reach you.
Open →The truth about the project — and how to show it upstairs
Goal graph, critical path, diff, time-travel — translated into money for the boss.
Open →From a Jira export to computed project context
Drop one CSV/JSON export — agit replays the history, reconstructs the true state with its distortions, and builds the goal graph and critical path for you. A guided walkthrough of the whole flow.
Open the scenario →We don't ask you to take our word — we ran a trial
Evidence-based-medicine style: a protocol registered before the data, a sample with no cherry-picking, pre-declared success criteria — on 8 well-known open-source projects, 2,400 tasks, every fact clickable to its source.
See the evidence →All use cases & PDF versions →
Built for owners who answer for delivery — and the leads who run it
You pay for the team's time — and can't clearly see what you're getting for it
You own both the product and the plan. The team ships, but at week's end it's not obvious which goals moved forward, which stalled, and what was just keeping the lights on. AG.it gives you that picture without forcing your engineers into PM rituals.
- At week's end, you can't name three goals the team actually moved forward
- Standup updates sound like activity, not progress
- Some work clearly mattered. A lot of it — unclear
- You can't say what to stop, redo, or keep doing next week
Also works for
- Tech leads who need a transparent weekly story for the founder
- PMO and multi-project portfolios
- Open source communities
48-hour pilot
We run it on your real data. You see a working report, not a demo. Takes 48 hours from first message to your first insight.
How it works
- Send what you already have — a tracker export (any CSV/XLSX), the list of your goals in your own words, and whatever you track on time and money. No special format required.
- We build the first weekly review for you — linking the work to your goals, flagging what stalled and what needs a decision.
- You read it like a report. HTML project page + portfolio view on your real data — not a templated demo.
- 30-minute call: we walk through what came out, what's missing, and decide whether it's worth doing every week.
What it can already do
Import plans
Batch from a directory or one by one. Via CLI/API.
Task ⇔ Goal mapping
Every task linked to a goal. Spot work without a goal — and goals without work behind them.
Reports
Project, portfolio, week-over-week. HTML + JSON (on request).
Structure linting
Checks for inconsistencies, gaps, risk areas.
Headless
API + CLI for integrations and CI. Swagger available for testing.
Focus lens
Surfaces goals at risk, upcoming deadlines, and work without a visible outcome.
Portfolio canvas
Money × timing for every project on one screen: secured / promised / at-risk bars, next milestone and computed finish. Groups with live subtotals.
Computed schedule
A Gantt you can't draw — only compute: bars derive from milestone and task dates, every bar edge clicks through to the task that holds it.
Integrations that write back — already
Two-way GitHub and Plane integration works today — AG.it reads state and writes status back to where your team works. Jira, your tracker and the AI assistant — on request: set up during onboarding, priced by scope.
Usage options
SaaS pilot (now)
Processing your files on a private instance through me. Fast, secure, no installation.
SaaS with client access (soon)
Keys, API, CLI and Telegram bot for your team.
On‑prem under NDA
Docker package without source disclosure + technical and legal IP protection measures.
Security
- Minimum data: goals (YAML) and task snapshots (CSV/XLSX).
- One‑shot processing: data is deleted after the pilot or on your request.
- NDA: signed before data transfer.
- Anonymization: you can replace names with tokens — the structure is preserved.
Pricing
Start with a free pilot on your data — no installation, no commitment.
We run it on your real data. You see a working report and get a 30-min walkthrough. No installation needed.
- Goal graph from your YAML
- Task snapshot linked to goals
- Money / acceptance / risk report
- 30-min walkthrough call
- API / CLI access
- Ongoing snapshots
SaaS access for your team. API, CLI, Telegram bot. No approval process — fits a personal card.
- Everything in Pilot
- SaaS with your team's access
- API + CLI for CI integrations
- Telegram bot for updates
- Ongoing snapshot history
Run your whole portfolio in one plane: every project's money, acceptance and risk rolled up — before the status meeting.
- Everything in Team
- Up to 30 projects in one portfolio
- More data sources & integrations
- Onboarding & migration help
- Priority support
Docker deployment, NDA, dedicated support, custom integrations. IP protected, source not disclosed.
- Everything in Portfolio
- On-prem Docker (no source)
- Data never leaves your perimeter
- Custom integrations
- Dedicated support
- SLA on request
Full read — money / acceptance / risk, acceptances & milestones, critical path — in every plan, from the free pilot. Plans differ by scale, data sources and support.
NDA is signed before any data transfer — on every plan, the pilot included.
FAQ
Input formats
YAML (goals), CSV/XLSX (task snapshots). Templates provided.
Integrations
GitHub and Plane — two-way today (read state + write status back). Jira and other trackers — on request, set up during onboarding. File exchange and API/CLI out of the box.
API
Swagger available for testing. External access granted on request.
Contacts
If you want to try it with your data — write to us.
Email: hello@altered-graphit.com
Founder: @alexey_gilin